
Ford Sales Data, Trends & Analysis for the Europe Automotive Market
Ford European market share has declined every year from 2009 to 2016, much like most other European mainstream brands like Fiat, Citroën and Opel, as the customer preferences have shifted towards premium or low-cost. As a result, the brand lost over a full percentage point between 2011 and 2016. Ford’s sales rose slightly in 2014 and 2015, but less than the overall market, causing another loss of market share and losing its position as Europe’s second best selling car brand to Renault.
Most of the decline is due to lack of new products, as the Mondeo, S-Max and Galaxy should have been replaced earlier if Ford hadn’t decided to close its manufacturing plant in Gent, Belgium. Preparing its Spanish factory for the production of these three models delayed their introduction a couple of years. When the new Mondeo finally arrived at European Ford dealers early 2015, the model was already a few years old, as Americans had been able to buy the similar Ford Fusion since 2012 and the new generation had been on sale in China from 2013. The new generations Ford Galaxy and S-Max also finally arrived in 2015 and the latter immediately reclaimed its segment lead.
The brand’s best selling model, Ford Fiesta, was facelifted in 2013 to give it an Aston Martin lookalike front end, but that hasn’t stopped the continuous decline in sales before recovering slightly in 2014 and 2015. The next generation will arrive in 2017. The third generation Ford Focus was introduced in 2011 but sales of the model have slowly declined since its first year.
Ford introduced the B-Max in 2012, which has taken the lead of the small MPV segment in Europe in 2013, but fell quickly back into fourth place in 2014, and the segment has been in continuous decline since. In 2014, the American brand introduced its small SUV Ecosport in Europe, to compete in the fastest growing segment of the continent. But it stood out from other Ford models because it was initially developed for countries like India and Argentina, so it is less refined than the models developed for Europe. Compare it more to the Dacia Duster than to the Nissan Juke or Renault Captur, although sales are still far behind any of those models, even after Ford updated it with an improved (modernized) dashboard and ditching the spare wheel on the back.
As part of the One Ford strategy, the new generation American muscle car Mustang was officially imported to Europe for the first time ever, and it was followed by the Edge large SUV in 2016. The aging Fiat-built Ka minicar was replaced by a low-budget subcompact hatchback from Brazil named Ka+, but considering the lack of success of the EcoSport, that may not be a wise decision.
Ford Europe Sales Figures & Recent Highlights
Ford Europe sales figures have been declining in recent years. In 2020, Ford sold 1.1 million cars in Europe. In 2021, Ford sales in Europe fell to 880,000 cars. And in 2022, Ford sales in Europe fell further to 680,000 cars. Overall, Ford Europe sales have been declining in recent years. The company is facing a number of challenges, including the popularity of SUVs, the shift to electric vehicles, and the lack of new models. Ford is working to address these challenges, but it remains to be seen if the company will be able to turn things around in Europe.
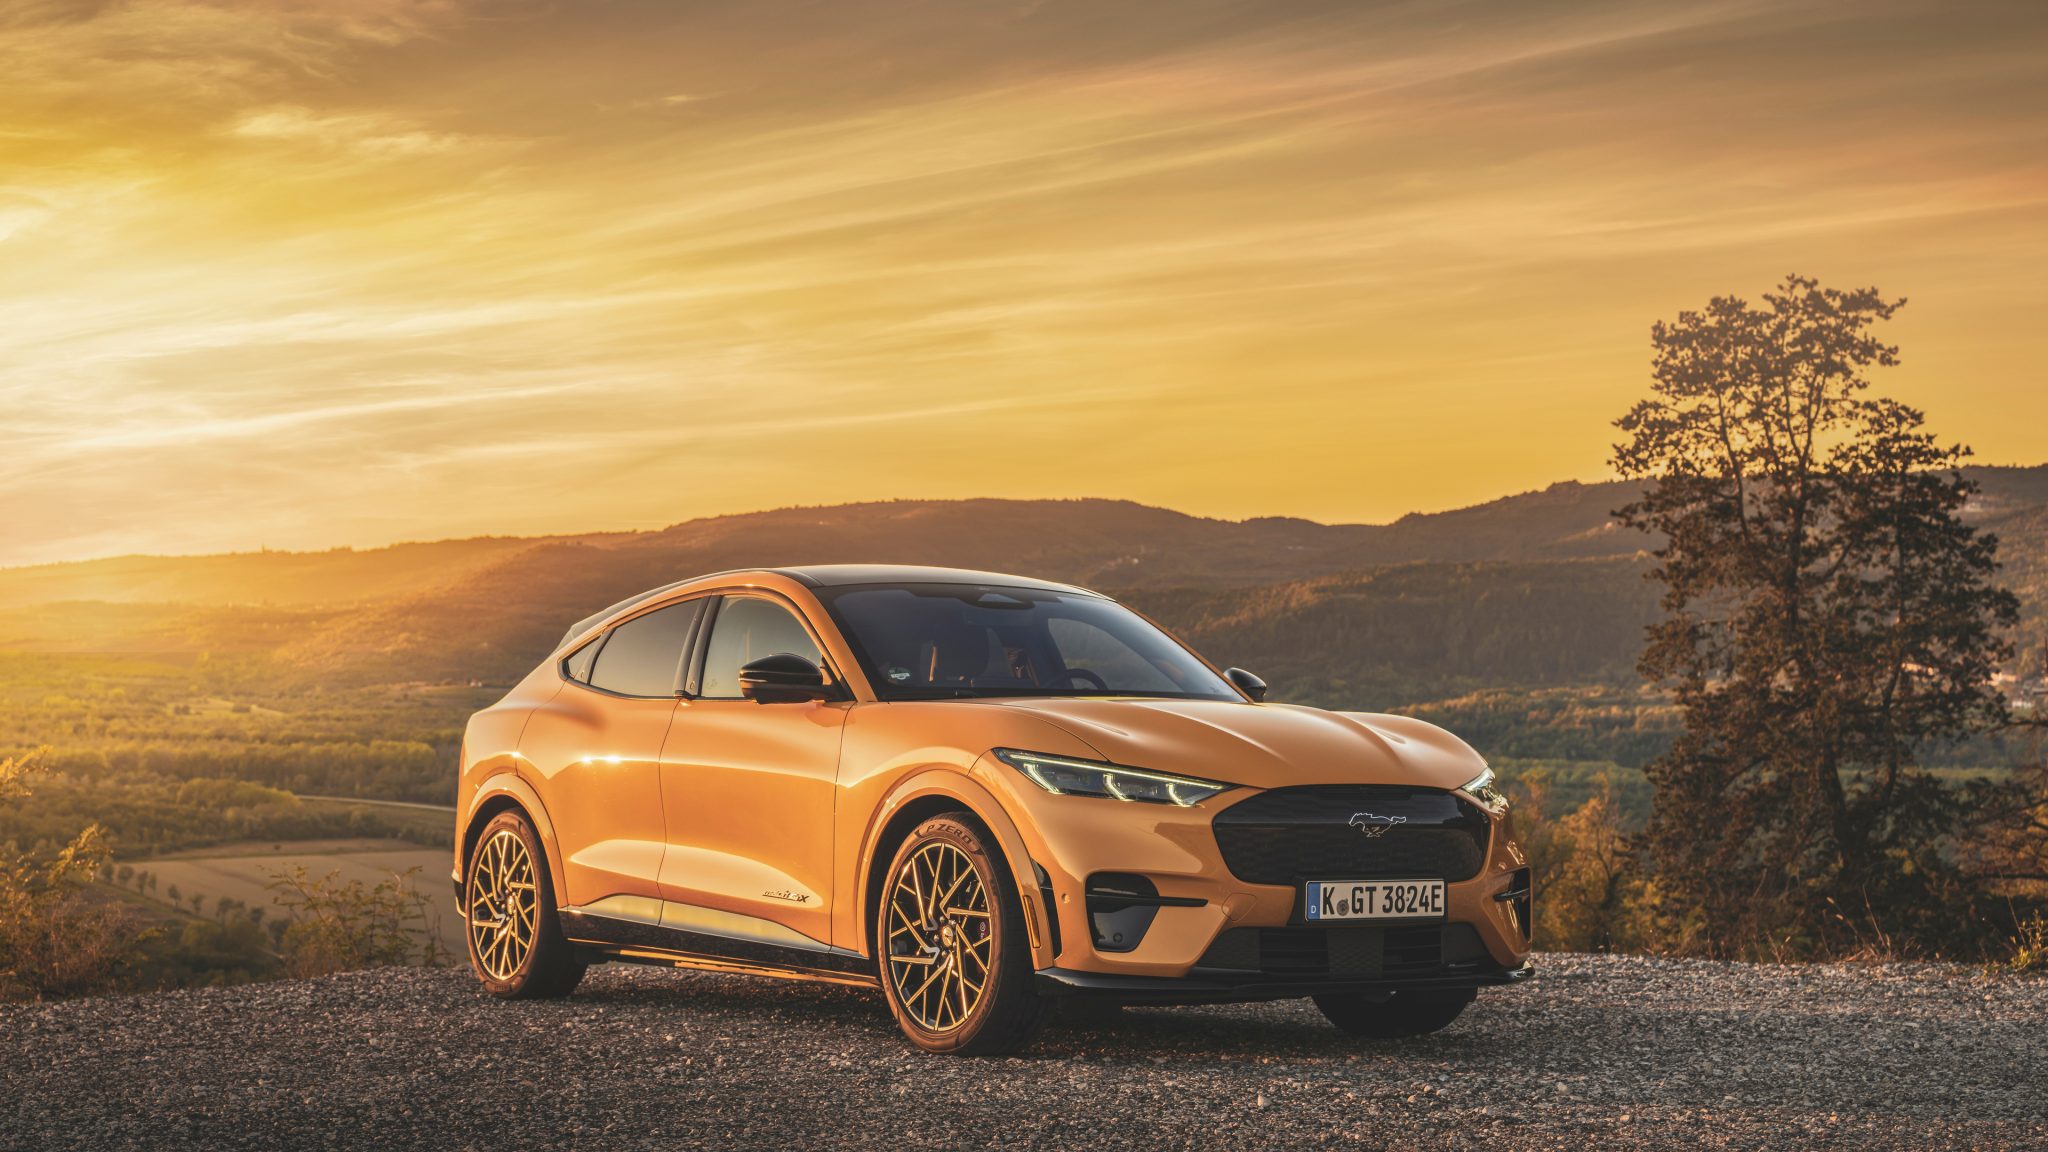
In 2022, Ford announced that it would invest €2 billion in electric vehicles and battery production in Europe. Ford also announced that it would launch seven new electric vehicles in Europe by 2024, including the Mustang Mach-E electric car. Ford is also working to improve its image in Europe. The company has launched a new advertising campaign that emphasizes Ford’s commitment to sustainability and innovation.
Ford Annual Sales Data and Market Share in Europe
Below we have a table that shows total Ford sales volumes for the European automotive market, broken out by year since 2005. This data captures all Ford vehicle sales for the entire Europe automotive market.
| Year | Sales | YOY Change | Marketshare | Marketshare Change |
|---|---|---|---|---|
| 1997 | 997,094 | 0.00 | 12.07 | 0.00 |
| 1998 | 989,738 | -0.74 | 10.45 | -15.45 |
| 1999 | 1,241,830 | 25.47 | 10.96 | 4.64 |
| 2000 | 1,167,327 | -6.00 | 9.97 | -9.91 |
| 2001 | 1,284,766 | 10.06 | 10.34 | 3.59 |
| 2002 | 1,255,255 | -2.30 | 10.03 | -3.08 |
| 2003 | 1,109,778 | -11.59 | 8.83 | -13.61 |
| 2004 | 1,089,933 | -1.79 | 7.81 | -13.03 |
| 2005 | 1,083,003 | -0.64 | 7.77 | -0.59 |
| 2006 | 1,065,233 | -1.64 | 7.73 | -0.55 |
| 2007 | 1,084,010 | 1.76 | 7.84 | 1.50 |
| 2008 | 1,034,233 | -4.59 | 8.03 | 2.28 |
| 2009 | 1,149,452 | 11.14 | 8.73 | 8.07 |
| 2010 | 1,023,250 | -10.98 | 8.09 | -7.93 |
| 2011 | 963,207 | -5.87 | 7.65 | -5.68 |
| 2012 | 844,785 | -12.29 | 7.45 | -2.73 |
| 2013 | 1,023,297 | 21.13 | 9.03 | 17.48 |
| 2014 | 1,112,567 | 8.72 | 9.23 | 2.21 |
| 2015 | 1,141,419 | 2.59 | 8.85 | -4.29 |
| 2016 | 1,109,015 | -2.84 | 8.01 | -10.54 |
| 2017 | 1,075,840 | -2.99 | 7.41 | -8.02 |
| 2018 | 947,674 | -11.91 | 6.62 | -12.07 |
| 2019 | 903,229 | -4.69 | 6.12 | -8.01 |
| 2020 | 578,336 | -35.97 | 5.16 | -18.77 |
| 2021 | 584,614 | 1.09 | 5.28 | 2.31 |
| 2022 | 544,497 | -6.86 | 5.30 | 0.36 |
Ford Europe Annual Sales Units & Growth Chart
Below is a visual representation of Ford’s Europe sales units over time. We have both the Ford sales units and the market share in the Europe market. Click on the items in the legend to see each series by itself.
Ford Europe Growth Rate & Market Share Chart
Below is the annual growth rate for the Ford brand in Europe, shown against the Ford’s marketshare changes in Europe. This gives you a good look into how Ford has faired against the other brands in terms of absolute sales and effect on marketshare. Click on the items in the legend to see each series by itself.
The Best-Selling Ford Cars & SUVs in Europe
COMING SOON
Sources: Manufacturers, ANDC, JATO Dynamics.


