Toyota Tundra
Here you will find monthly and yearly Canadian and U.S. sales figures for the Toyota Tundra. The Toyota Tundra is a full-size pickup truck manufactured by the Japanese automaker Toyota. The Toyota Tundra represents Toyota’s effort to compete in the full-size truck segment dominated by American automakers. Its emphasis on reliability, various configurations, and ongoing improvements to design and technology have made it a noteworthy option in the full-size truck market.
Toyota Tundra Overview
The Toyota Tundra is a full-size pickup truck produced by the Japanese automaker Toyota. It was first introduced in 1999 as a replacement for the Toyota T100. The Tundra is available with a choice of two engines: a 4.0-liter V6 engine and a 5.7-liter V8 engine. It is available in both rear-wheel drive and four-wheel drive configurations. The Tundra has been praised for its powerful engines, rugged construction, and comfortable ride. It has also been awarded a number of safety awards, including a five-star rating from the National Highway Traffic Safety Administration (NHTSA). The Tundra is a popular choice for those who need a powerful and capable pickup truck. It is also a good choice for those who want a truck that is comfortable and reliable.
Toyota Tundra Sales Data & Trends
Since its introduction in 1999, it has become one of Toyota’s prominent offerings in the highly competitive North American truck market. Throughout its production, the Tundra has been known for its durability, reliability, and strong resale value. It has been available in various body styles, including regular cab, double cab, and CrewMax, and has offered features like touchscreen infotainment systems, advanced driver-assistance systems, and off-road capabilities in specific trims like the TRD Pro. However, the Tundra has faced stiff competition from American truck manufacturers, and its market share in the full-size pickup segment has been more limited compared to domestic competitors.
Toyota Tundra U.S Sales Data & Charts
U.S Monthly Sales
U.S Annual Sales
| Year | Sales Units |
|---|---|
| 2005 | 126,529 |
| 2006 | 124,508 |
| 2007 | 196,555 |
| 2008 | 134,249 |
| 2009 | 79,385 |
| 2010 | 93,309 |
| 2011 | 82,908 |
| 2012 | 101,621 |
| 2013 | 112,732 |
| 2014 | 118,493 |
| 2015 | 118,880 |
| 2016 | 114,489 |
| 2017 | 116,285 |
| 2018 | 118,258 |
| 2019 | 111,673 |
| 2020 | 109,203 |
| 2021 | 81,959 |
| 2022 | 104,404 |
| 2023 | 125,185 |
| 2024 | 36,215 |
U.S Annual Growth
Toyota Tundra Canada Sales Data & Charts
Canada Annual Sales
| Year | Sales Units |
|---|---|
| 2012 | 7,241 |
| 2013 | 7,535 |
| 2014 | 9,769 |
| 2015 | 10,829 |
| 2016 | 11,364 |
| 2017 | 9,442 |
| 2018 | 11,738 |
| 2019 | 9,966 |
| 2020 | 11,053 |
| 2021 | 6,654 |
| 2022 | 5,122 |
Canada Annual Growth
Toyota Tundra Generations
First Generation (2000-2006)
The first-generation Tundra was introduced as a 2000 model year and was a more significant and powerful successor to the Toyota T100. With a V8 engine option and more substantial towing capacity, it was designed to compete directly with American full-size pickup trucks.
Second Generation (2007-2021)
The second generation marked a significant redesign, with a larger frame, increased towing capacity, and greater focus on performance and comfort. Engine options included a V6 as well as various V8 options. Over time, Toyota introduced different trim levels and special editions to keep the truck updated.
In 2014, the Tundra received a major facelift, with changes to the exterior styling, interior features, and technological enhancements.
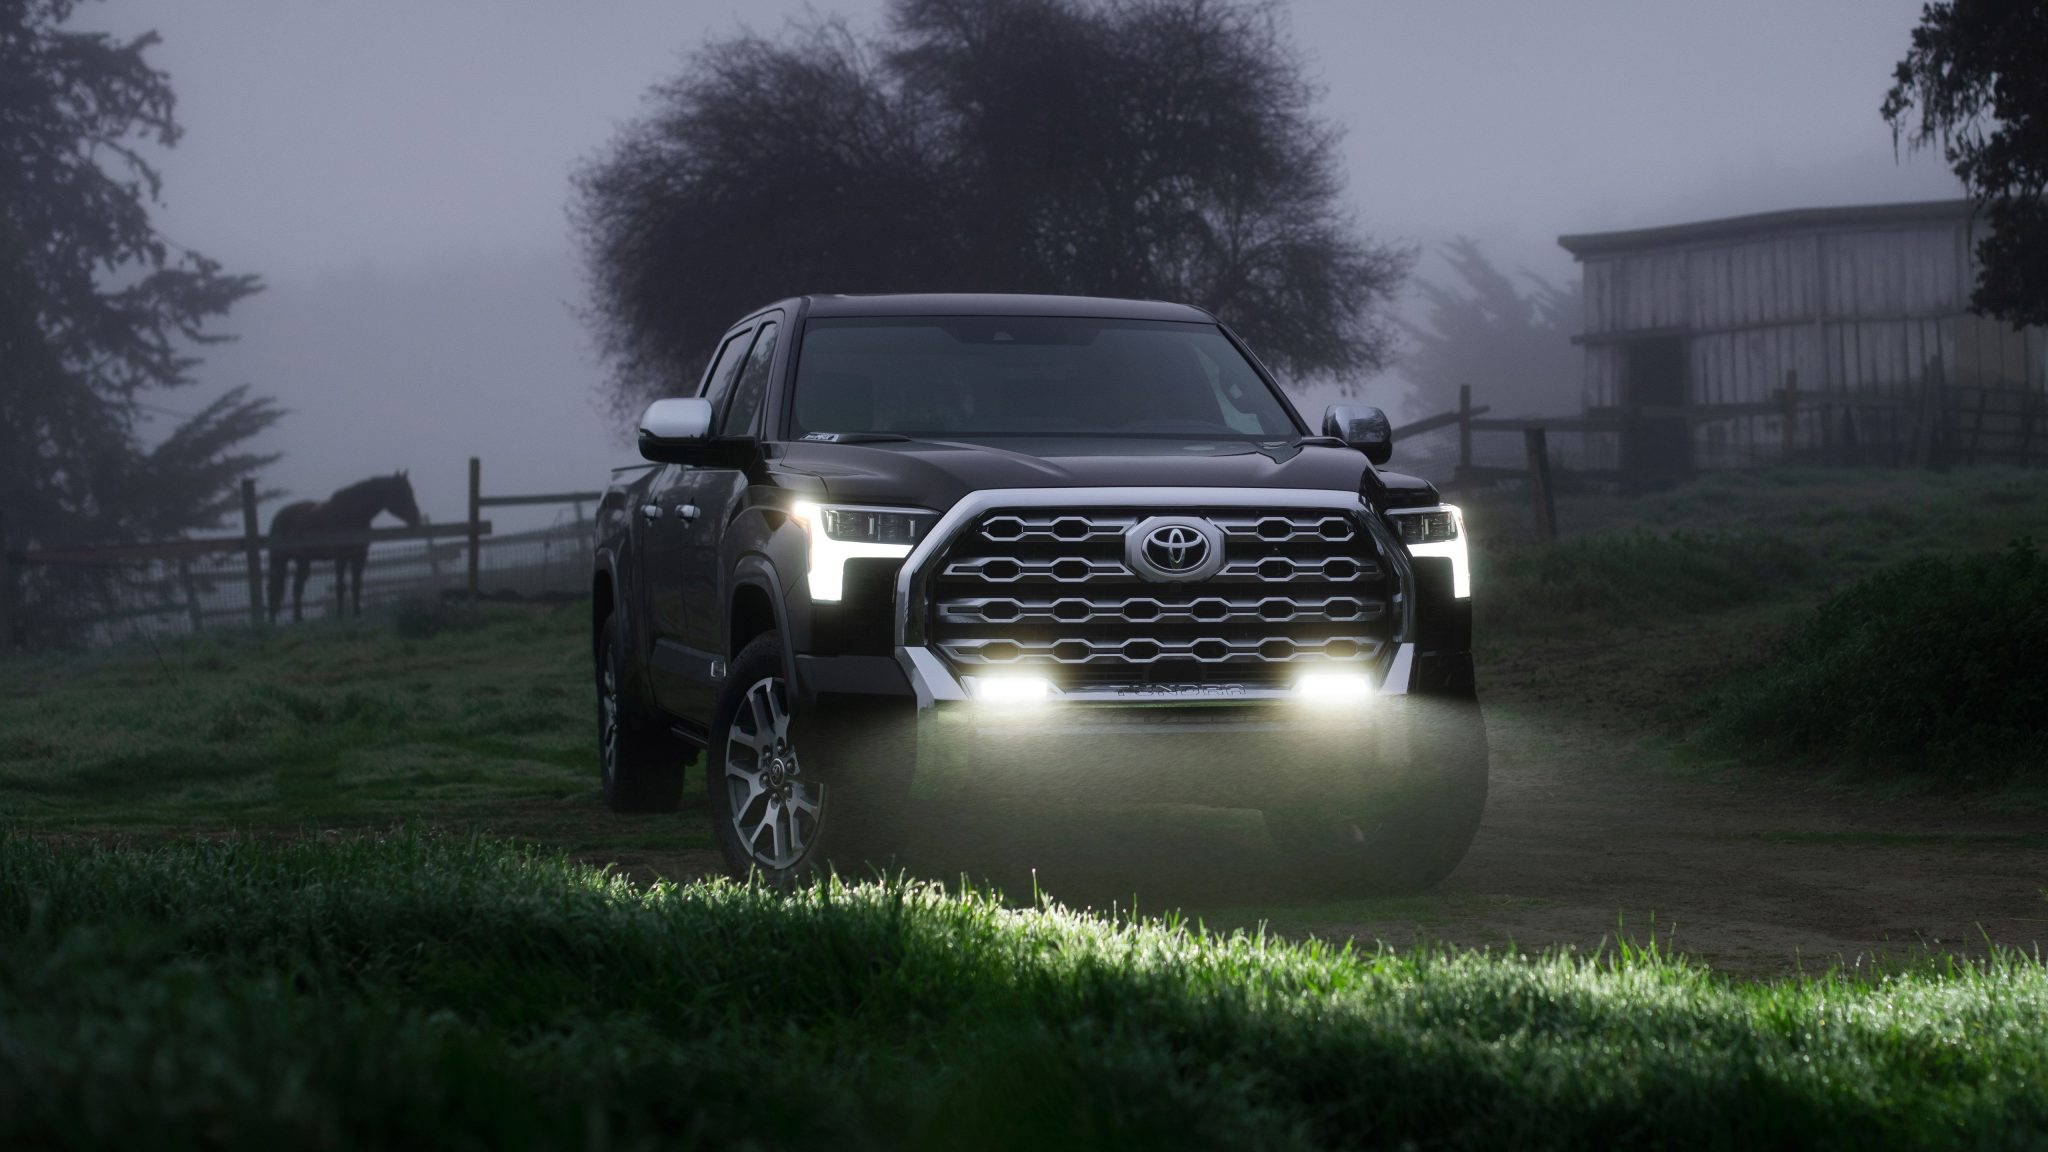
Third Generation (2022-)
Unveiled in 2021, the third generation introduced a complete overhaul of the Tundra, including new powertrain options like a twin-turbo V6 engine and a hybrid variant. The redesign emphasized modern styling, advanced technology, and improved fuel efficiency.