The Toyota Tacoma
The Toyota Tacoma is a mid-size pickup truck produced by the Japanese automaker Toyota. Here you will find Canadian and U.S. sales figures for the Toyota Tacoma. Overall, the Toyota Tacoma is a great choice for those who are looking for a capable, reliable, and off-road-ready pickup truck. However, it is expensive and not as fuel-efficient or spacious as some rivals.
Toyota Tacoma Overview
The Toyota Tacoma is a mid-size pickup truck produced by the Japanese automaker Toyota. It was first introduced in 1995 as a replacement for the Toyota Hilux. The Tacoma is available with a choice of two engines: a 2.7-liter four-cylinder engine and a 4.0-liter V6 engine. It is available in both rear-wheel drive and four-wheel drive configurations. The Tacoma has been praised for its rugged construction, off-road capability, and reliability. It has also been awarded a number of safety awards, including a five-star rating from the National Highway Traffic Safety Administration (NHTSA).
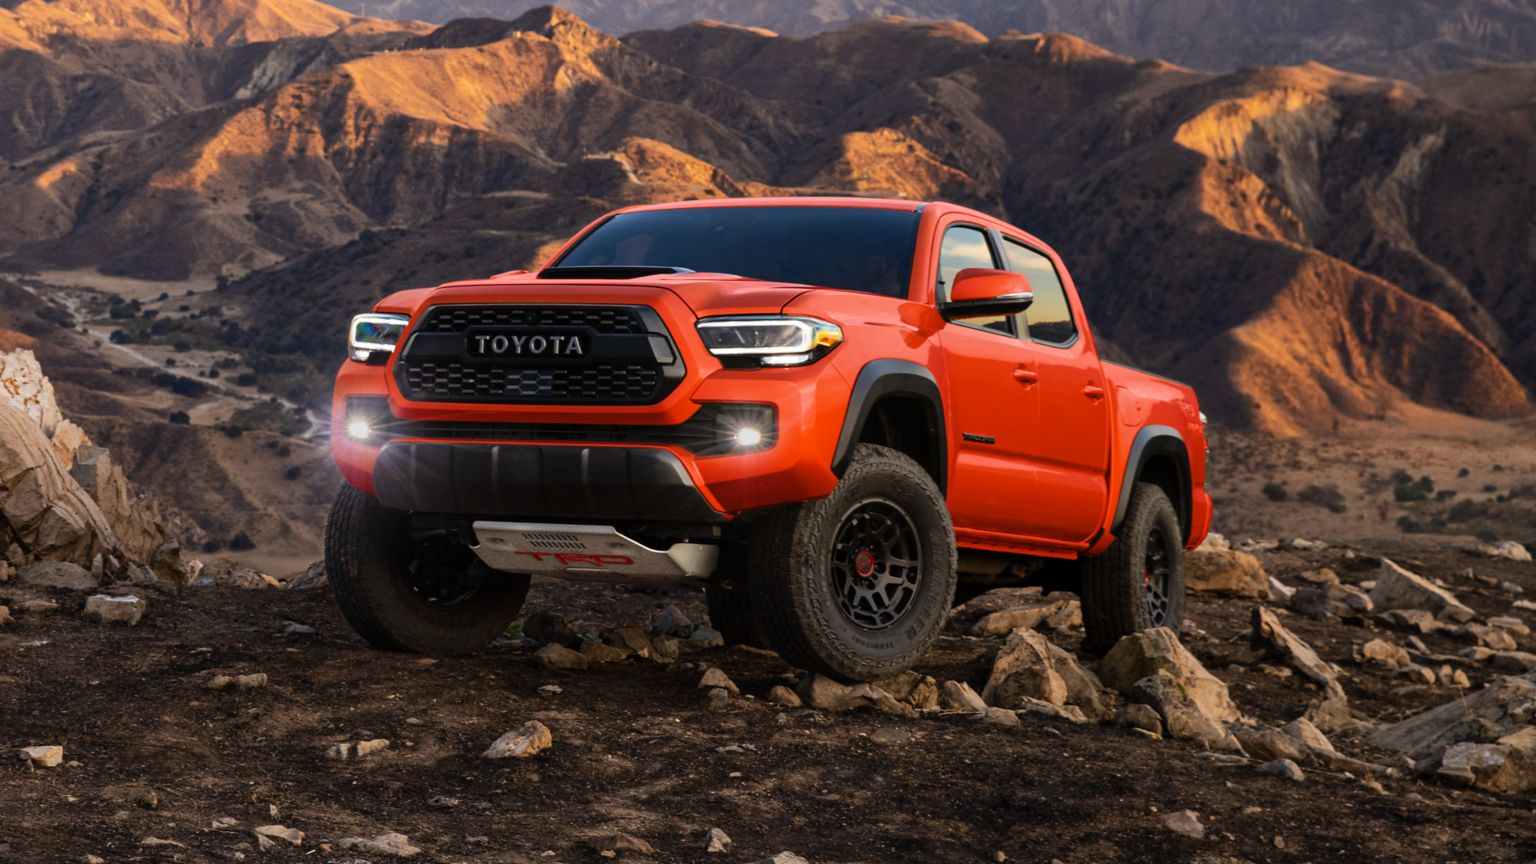
The Tacoma is a popular choice for those who need a capable and reliable pickup truck. It is also a good choice for those who want a truck that can be taken off-road. The Tacoma is also available in a TRD Pro trim level, which is designed for off-road use. The TRD Pro comes with a number of features that make it more capable off-road, such as a Bilstein suspension, a locking rear differential, and skid plates.
Toyota Tacoma Sales Data & Trends
The Toyota Tacoma’s blend of performance, off-road capability, reliability, and variety of configurations has allowed it to remain a competitive player in the mid-size pickup truck segment. Its reputation as a sturdy and versatile truck continues to attract a broad range of consumers, from off-road enthusiasts to those looking for a practical daily driver.
Toyota Tacoma U.S Sales Data & Charts
Since its introduction, the Tacoma has become one of the best-selling mid-size pickups in North America. Its reputation for durability, off-road capability, and overall quality has contributed to its popularity.
U.S Monthly Sales
U.S Annual Sales
| Year | Sales Units |
|---|---|
| 2005 | 168,811 |
| 2006 | 178,351 |
| 2007 | 173,238 |
| 2008 | 144,653 |
| 2009 | 111,824 |
| 2010 | 107,198 |
| 2011 | 110,705 |
| 2012 | 131,753 |
| 2013 | 159,485 |
| 2014 | 155,041 |
| 2015 | 179,562 |
| 2016 | 191,631 |
| 2017 | 198,124 |
| 2018 | 245,659 |
| 2019 | 248,801 |
| 2020 | 238,805 |
| 2021 | 252,490 |
| 2022 | 215,853 |
| 2023 | 234,768 |
| 2024 | 21,558 |
U.S Annual Growth
Toyota Tacoma Canada Sales Data & Charts
Canada Annual Sales
| Year | Sales Units |
|---|---|
| 2012 | 9,904 |
| 2013 | 10,400 |
| 2014 | 9,973 |
| 2015 | 11,772 |
| 2016 | 12,618 |
| 2017 | 12,454 |
| 2018 | 13,878 |
| 2019 | 12,536 |
| 2020 | 16,946 |
| 2021 | 14,879 |
| 2022 | 7,529 |
Canada Annual Growth
Toyota Tacoma Generations
First Generation (1995-2004)
The first generation of the Toyota Tacoma was introduced in 1995 as a replacement for the Toyota Hilux. It was available in two cab configurations: a regular cab and a double cab. It was also available with two bed lengths: a short bed and a long bed. The first generation Tacoma was powered by a 2.7-liter four-cylinder engine or a 4.0-liter V6 engine. It was available in both rear-wheel drive and four-wheel drive configurations. The first generation Tacoma was praised for its rugged construction, off-road capability, and reliability. It was also awarded a number of safety awards, including a five-star rating from the National Highway Traffic Safety Administration (NHTSA).
Second Generation (2005-2015)
The second generation of the Toyota Tacoma was introduced in 2005. It was available in three cab configurations: a regular cab, a double cab, and a crew cab. It was also available with two bed lengths: a short bed and a long bed. The second generation Tacoma was powered by a 2.7-liter four-cylinder engine, a 4.0-liter V6 engine, or a 4.0-liter V6 engine with a diesel engine. It was available in both rear-wheel drive and four-wheel drive configurations. The second generation Tacoma was praised for its rugged construction, off-road capability, and reliability. It was also awarded a number of safety awards, including a five-star rating from the National Highway Traffic Safety Administration (NHTSA).
Third Generation (2016-Present)
The third generation of the Toyota Tacoma was introduced in 2016. It is the current generation of the Tacoma. It is available in three cab configurations: a regular cab, a double cab, and a crew cab. It is also available with two bed lengths: a short bed and a long bed. The third generation Tacoma is powered by a 2.7-liter four-cylinder engine, a 3.5-liter V6 engine, or a 3.5-liter V6 engine with a hybrid engine. It is available in both rear-wheel drive and four-wheel drive configurations. The third generation Tacoma has been praised for its rugged construction, off-road capability, and reliability. It has also been awarded a number of safety awards, including a five-star rating from the National Highway Traffic Safety Administration (NHTSA). The third generation Tacoma is the most popular generation of the Tacoma to date. It has been praised for its improved fuel economy, its more comfortable ride, and its more modern interior.