Toyota Supra
Here you will find monthly and yearly Canadian, European and U.S. sales figures for the Toyota Supra. The Toyota Supra was introduced in 2019 after 17 years without a model carrying that name. The Toyota Supra is one of the most iconic and revered sports cars in automotive history. Recognized for its performance, design, and its role in car culture (especially in media like the “Fast & Furious” franchise), the Supra has a storied history spanning several decades.
Toyota Supra Overview
The Supra’s lineage began in 1978 as a larger and more powerful offshoot of the Toyota Celica. Initially called the Celica Supra, it was essentially a lengthened Celica with a 6-cylinder engine instead of the Celica’s 4-cylinder. The Celica Supra’s design became more distinctive, separating itself further from the standard Celica when the second generation launched in 1981. It retained the front-engine, rear-wheel-drive layout and continued to focus on enhancing performance and driving pleasure.
Arguably the most iconic of all Supra models, the A80 was a departure from previous designs with its more curvaceous and aerodynamic shape. Powered by the legendary 2JZ engine, particularly the 2JZ-GTE twin-turbo variant, this Supra could compete with much more expensive sports cars. The engine was known for its robustness and massive tuning potential. This generation gained significant fame due to its performance capabilities, appearances in movies and video games, and its tuner culture appeal.
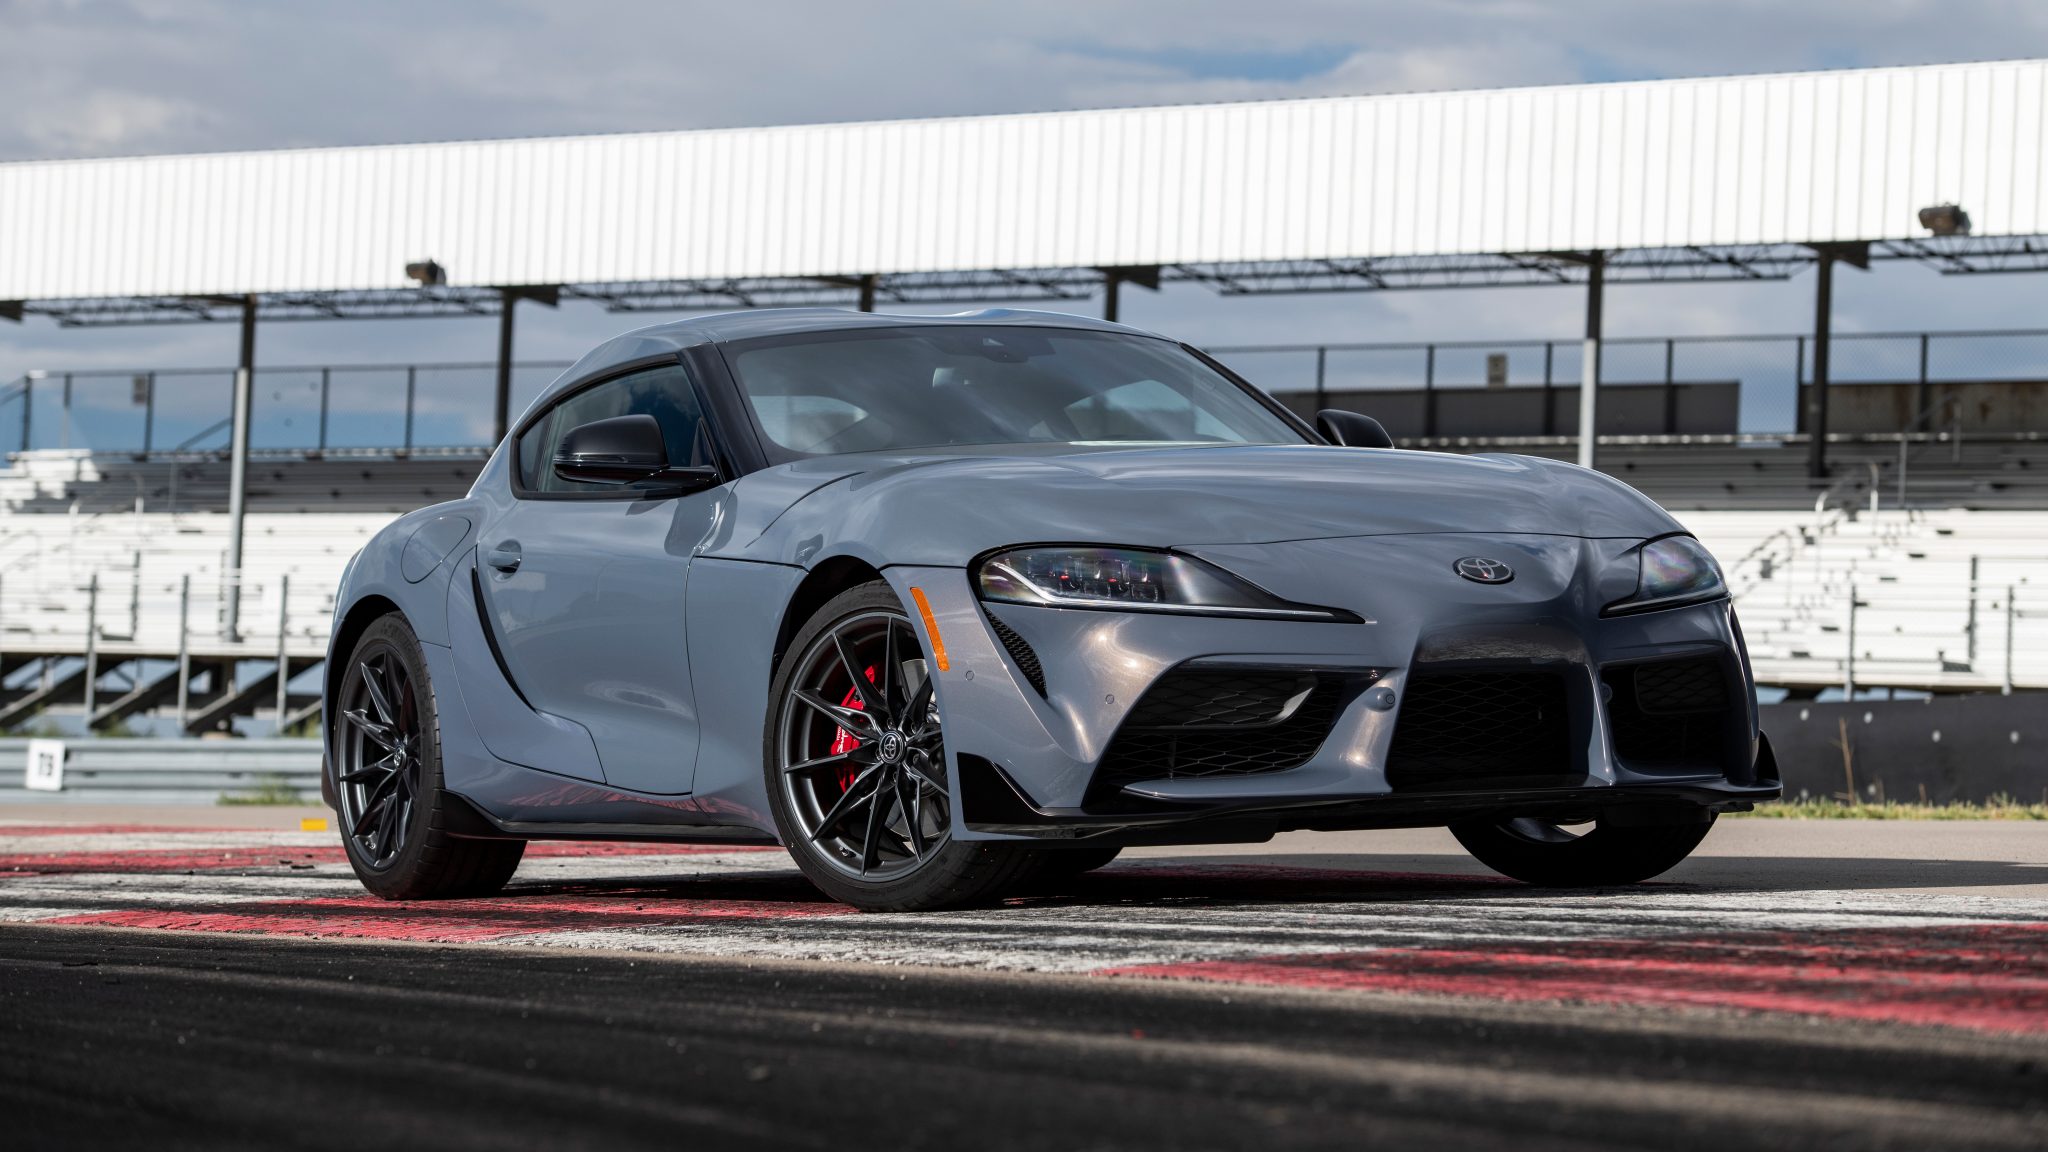
After much anticipation, Toyota, in collaboration with BMW, launched the fifth-generation Supra. This joint venture also resulted in the BMW Z4. The Toyota GR Supra is a sports car that was first introduced in 2019. It is a joint development project between Toyota and BMW, and it is based on the same platform as the BMW Z4.
The Supra is powered by a 3.0-liter turbocharged inline-6 engine that produces 382 horsepower and 368 lb-ft of torque. It is available with a choice of an 8-speed automatic transmission or a 6-speed manual transmission. The Supra is available in two trim levels: 3.0 and 3.0 Premium. The 3.0 trim comes standard with features like a 12.3-inch digital instrument cluster, a 8.8-inch touchscreen infotainment system, and a JBL sound system. The 3.0 Premium trim adds features like a heated steering wheel, a heated front passenger seat, and a leather-wrapped interior.
Toyota Supra Sales Figures
Toyota Supra U.S Sales Data & Charts
US Monthly Sales
US Annual Sales
| Year | Sales Units |
|---|---|
| 2019 | 2,884 |
| 2020 | 5,887 |
| 2021 | 6,830 |
| 2022 | 4,952 |
| 2023 | 2,652 |
| 2024 | 484 |
US Annual Growth
Toyota Supra Canada Sales Data & Charts
Canada Annual Sales
| Year | Sales Units |
|---|---|
| 2019 | 252 |
| 2020 | 394 |
| 2021 | 410 |
| 2022 | 215 |
Canada Annual Growth
Toyota Supra Europe Sales Data & Charts
Europe Annual Sales
| Year | Sales Units |
|---|---|
| 2019 | 893 |
| 2020 | 947 |
| 2021 | 966 |
| 2022 | 808 |