Toyota Sequoia
Here you will find Canadian and U.S. sales figures for the Toyota Sequoia. The Toyota Sequoia is a full-size SUV manufactured by Toyota. Named after the massive Sequoia tree, this SUV is known for its large size, strong performance, and capability as a family and towing vehicle. Overall, the Toyota Sequoia is a great choice for those who are looking for a large, comfortable, and powerful SUV. It is not the most fuel-efficient or technologically advanced SUV on the market, but it is a reliable and capable vehicle that is perfect for families and those who need a large SUV for towing or off-road use.
Toyota Sequoia Overview
The Toyota Sequoia is a full-size SUV produced by the Japanese automaker Toyota. It was first introduced in 2000 as a replacement for the Toyota Land Cruiser Prado. The Toyota Sequoia stands out as a full-size SUV with strong towing abilities, a roomy interior, and solid reliability. While its design may not be as updated as some competitors, its core attributes of space, power, and Toyota’s reputation for dependability continue to make it an appealing choice for those in need of a substantial family SUV.
The Sequoia is available in three trim levels: SR5, Limited, and Platinum. It is available in rear-wheel drive and four-wheel drive configurations. The Sequoia is powered by a 5.7-liter V8 engine that produces 381 horsepower and 401 pound-feet of torque. It is mated to a six-speed automatic transmission. The Sequoia has been praised for its spacious interior, comfortable ride, and powerful engine. It has also been awarded a number of safety awards, including a five-star rating from the National Highway Traffic Safety Administration (NHTSA).
Toyota Sequoia Sales Data & Trends
The Sequoia is the largest SUV in the Toyota lineup. It is a popular choice for families and those who need a large and comfortable SUV. It is also a good choice for those who need a powerful SUV for towing or off-road use.
Toyota Sequoia U.S Sales Data & Charts
U.S Monthly Sales
U.S Annual Sales
| Year | Sales Units |
|---|
U.S Annual Growth
Toyota Sequoia Canada Sales Data & Charts
Canada Annual Sales
| Year | Sales Units |
|---|
Canada Annual Growth
Toyota Sequoia Generations
First Generation (2001-2007)
Introduced in 2000 for the 2001 model year, the first-generation Sequoia was based on the Toyota Tundra pickup truck’s platform. It was designed with the North American market in mind, aiming to compete with other large SUVs. This generation was powered by a 4.7-liter V8 engine, coupled with a 4-speed automatic transmission. Inside, the Sequoia offered three rows of seating, accommodating up to eight passengers. The first generation Sequoia was praised for its spacious interior, comfortable ride, and powerful engine. It was also awarded a number of safety awards, including a five-star rating from the National Highway Traffic Safety Administration (NHTSA).
Second Generation (2008-2022)
The second generation of the Toyota Sequoia was introduced in 2008. It was available in two wheelbases: a standard wheelbase and a long wheelbase. It was also available in three trim levels: SR5, Limited, and Platinum. The second generation Sequoia was powered by a 4.6-liter V8 engine that produced 310 horsepower and 327 pound-feet of torque. It was mated to a six-speed automatic transmission. The second generation Sequoia was praised for its improved fuel economy, its more comfortable ride, and its more modern interior. It was also awarded a number of safety awards, including a five-star rating from the National Highway Traffic Safety Administration (NHTSA).
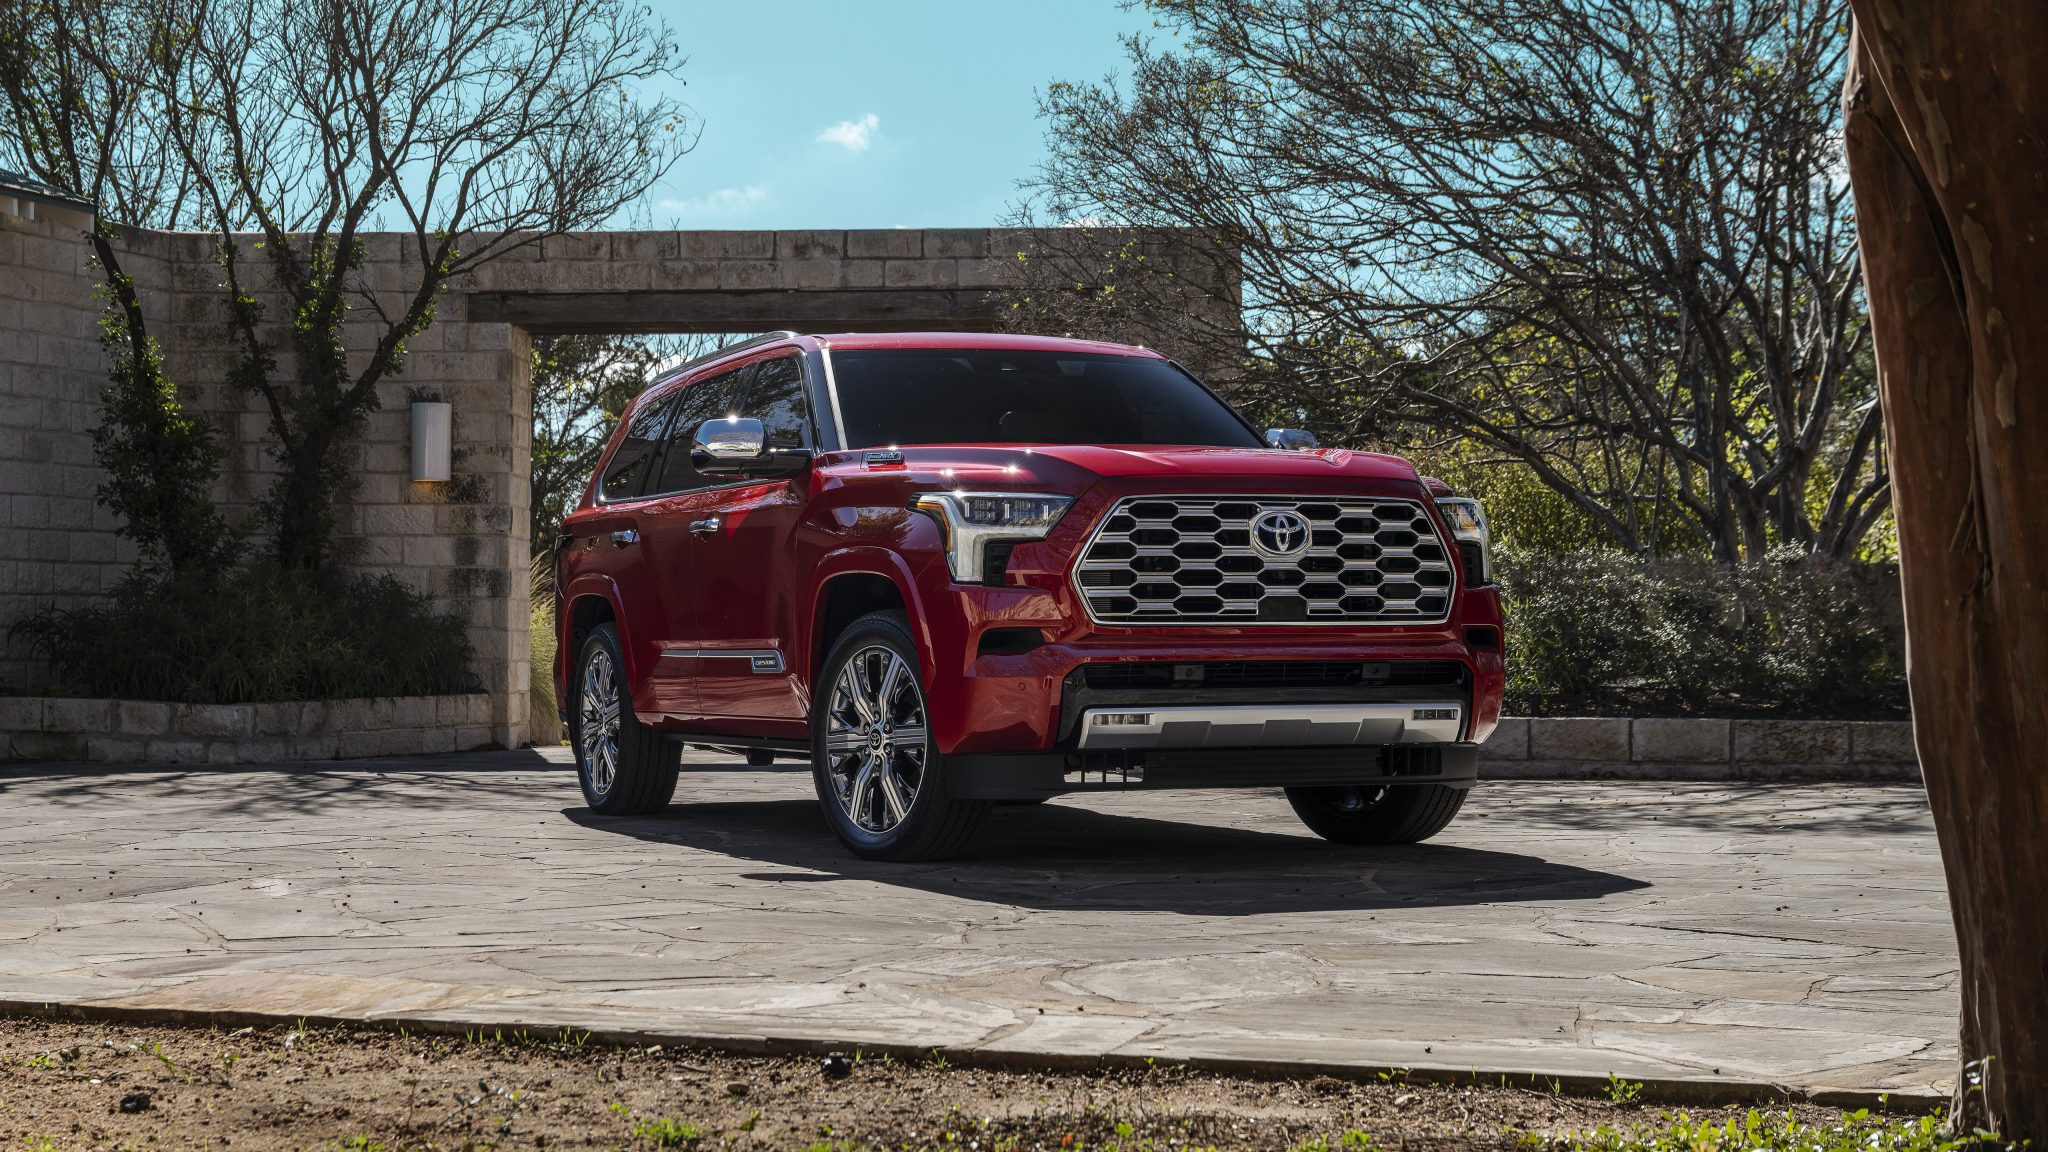
Third generation (2023-present)
The third generation of the Toyota Sequoia was introduced in 2023. It is the current generation of the Sequoia. It is available in two wheelbases: a standard wheelbase and a long wheelbase. It is also available in three trim levels: SR5, Limited, and Platinum. The third generation Sequoia is powered by a 3.5-liter twin-turbocharged V6 engine that produces 415 horsepower and 479 pound-feet of torque. It is mated to an eight-speed automatic transmission. The third generation Sequoia has been praised for its improved fuel economy, its more comfortable ride, and its more modern interior. The third generation Sequoia is the most powerful and efficient Sequoia yet. It is also the most technologically advanced Sequoia yet, with features like a 12.3-inch digital instrument cluster and a 14-inch touchscreen infotainment system.