
Toyota Prius
Here you will find monthly and yearly Canadian and U.S. sales figures for the Toyota Prius. Take note, this is total Prius volume – Liftback (sedan), Prius V, Prius C, and Prius-Plug-In – not simply the sales for the Prius Liftback. The Toyota Prius is a hybrid electric vehicle (HEV) that was first introduced by Toyota in 1997 in Japan, and has since become one of the world’s best-selling hybrid vehicles.
Toyota Prius Overview
The main concept behind the Prius is to offer a vehicle with improved fuel efficiency and reduced greenhouse gas emissions compared to traditional gasoline-only vehicles. The Prius uses Toyota’s Hybrid Synergy Drive system, which combines a gasoline internal combustion engine with an electric motor. This combination allows the Prius to operate in electric-only mode, gasoline-only mode, or a combination of both, depending on driving conditions.
The Prius gained significant attention due to its environmentally-friendly appeal, especially in markets like the United States and Europe. Over the years, it became symbolic of the green movement and was adopted by various celebrities, further boosting its public profile. The Prius has been a platform for Toyota to introduce various technological innovations, such as regenerative braking (which converts braking energy into electricity to charge the battery), advanced aerodynamics, and various driver-assist features.
Over the years, Toyota expanded the Prius lineup. This included the Prius v (a larger, wagon-like variant), the Prius c (a smaller, more city-oriented model), and the Prius Prime (a plug-in hybrid variant). While the Prius has been praised for its fuel efficiency and environmental benefits, it has also faced criticism for its driving dynamics and design. However, its positive impact on promoting hybrid technology in the automotive industry is undeniable.
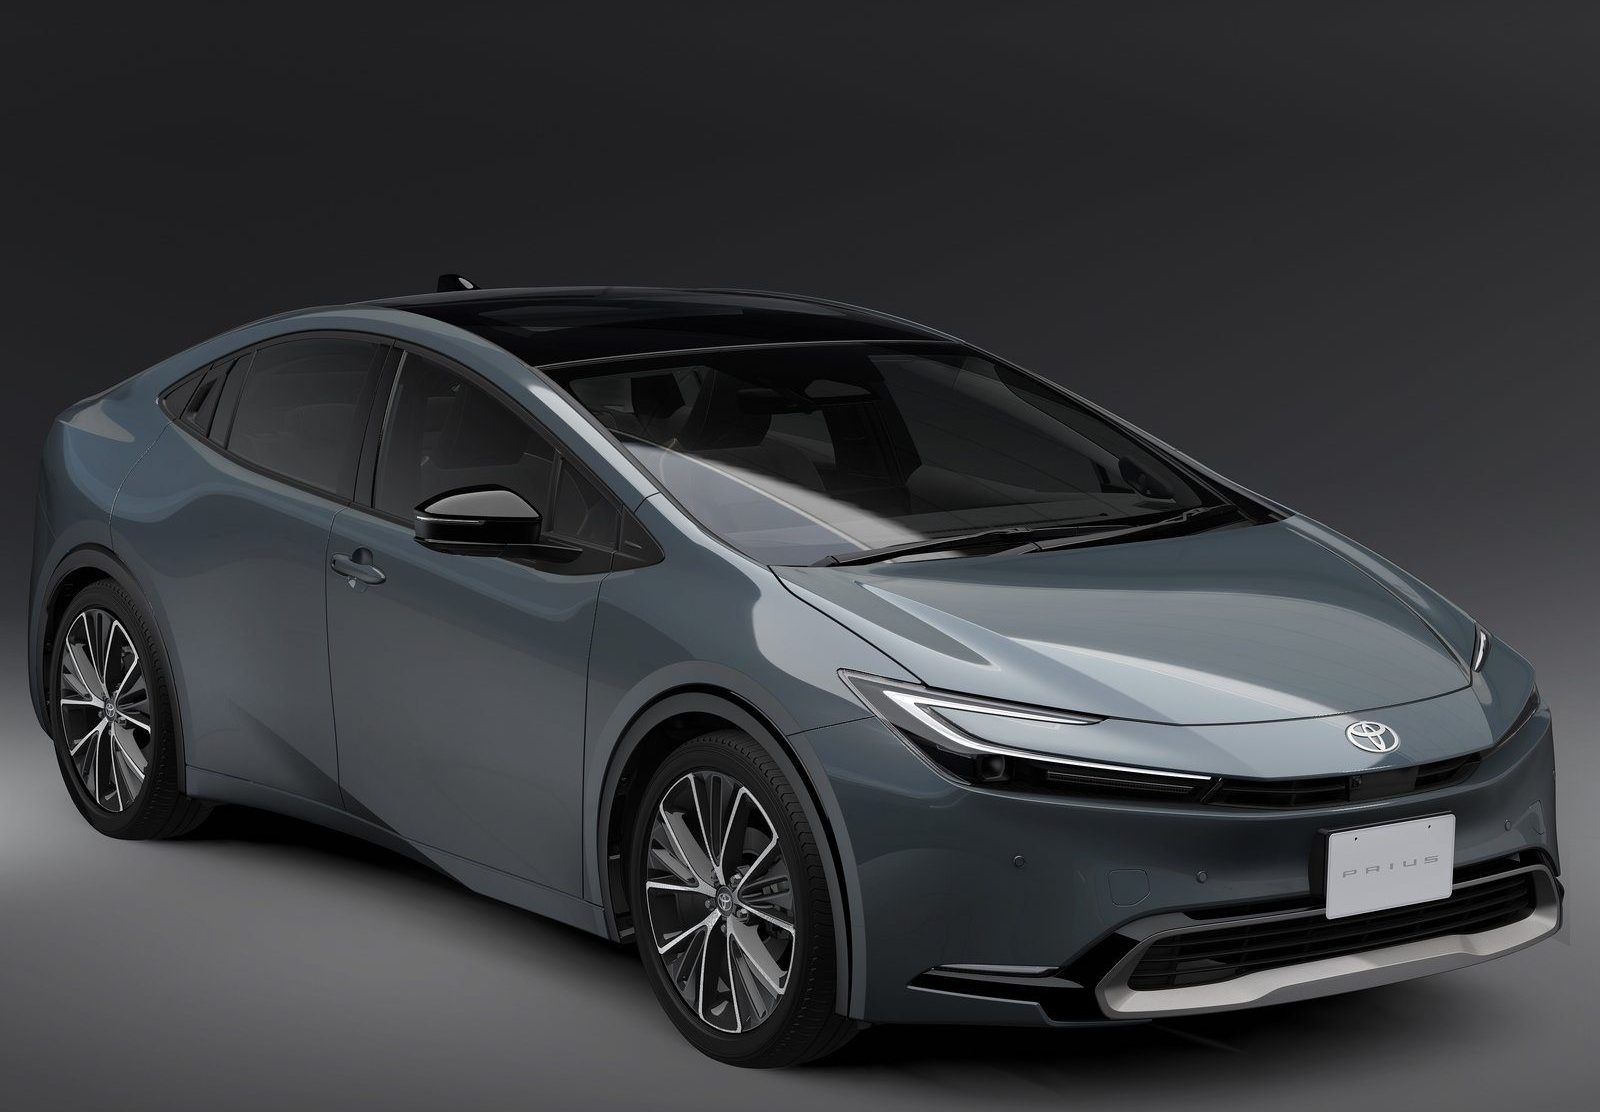
The Prius uses a gasoline engine and an electric motor to power the wheels. The current gasoline engine is a 2.0-liter four-cylinder engine that produces 150 horsepower. The electric motor produces 71 horsepower. The two power sources work together to deliver a combined output of 194 horsepower. The Prius gets an EPA-estimated 52 mpg in the city and 52 mpg on the highway. It has a driving range of over 600 miles.
The Prius is available in a variety of trim levels, including the LE, LE Eco, XLE, and Limited. The LE is the base trim level and comes standard with features such as a 7-inch touchscreen infotainment system, a rearview camera, and Bluetooth. The LE Eco trim level gets better fuel economy than the LE trim level. The XLE trim level adds features such as a sunroof, leather seats, and a JBL sound system. The Limited trim level is the top-of-the-line trim level and comes standard with features such as a 11.6-inch touchscreen infotainment system, a navigation system, and a wireless charging pad.
Toyota Prius Sales Figures
Toyota Prius U.S Sales Data & Charts
US Monthly Sales
US Annual Sales
| Year | Sales Units |
|---|---|
| 2005 | 107,155 |
| 2006 | 106,971 |
| 2007 | 181,221 |
| 2008 | 158,884 |
| 2009 | 150,831 |
| 2010 | 140,928 |
| 2011 | 136,464 |
| 2012 | 236,655 |
| 2013 | 234,228 |
| 2014 | 207,372 |
| 2015 | 184,794 |
| 2016 | 136,629 |
| 2017 | 108,661 |
| 2018 | 87,590 |
| 2019 | 69,718 |
| 2020 | 43,525 |
| 2021 | 59,010 |
| 2022 | 33,352 |
| 2023 | 35,816 |
| 2024 | 13,327 |
US Annual Growth
Toyota Prius Canada Sales Data & Charts
Canada Annual Sales
| Year | Sales Units |
|---|---|
| 2012 | 10,041 |
| 2013 | 7,130 |
| 2014 | 6,963 |
| 2015 | 6,027 |
| 2016 | 8,095 |
| 2017 | 7,977 |
| 2018 | 9,174 |
| 2019 | 10,505 |
| 2020 | 6,417 |
| 2021 | 6,075 |
| 2022 | 2,058 |
Canada Annual Growth
Toyota Prius Europe Sales Data & Charts
These statistics include sales of the Toyota Prius compact hatchback and its Plug-in Hybrid version, and exclude sales of the Toyota Prius+ compact MPV .
Europe Annual Sales
| Year | Sales Units |
|---|---|
| 1999 | 2 |
| 2000 | 1,386 |
| 2001 | 4,590 |
| 2002 | 1,656 |
| 2003 | 1,558 |
| 2004 | 15,790 |
| 2005 | 37,054 |
| 2006 | 45,376 |
| 2007 | 63,878 |
| 2008 | 81,770 |
| 2009 | 83,978 |
| 2010 | 85,918 |
| 2011 | 49,500 |
| 2012 | 46,072 |
| 2013 | 32,196 |
| 2014 | 16,324 |
| 2015 | 15,276 |
| 2016 | 32,696 |
| 2017 | 27,260 |
| 2018 | 24,506 |
| 2019 | 14,908 |
| 2020 | 9,210 |
| 2021 | 5,982 |
| 2022 | 1,545 |
Europe Annual Growth
Toyota Prius China Sales Data & Charts
China Annual Sales
| Year | Sales Units |
|---|---|
| 2019 | 28,232 |
| 2020 | 4,442 |
| 2021 | 9,676 |
China Annual Growth
Toyota Prius Generations
First Generation (1997-2003)
The first-generation Prius was introduced in Japan in 1997 and was later launched globally. It was a compact sedan with a distinctive design that emphasized its unique hybrid technology. The first generation Prius was introduced in in the United States in 2000. It was powered by a 1.5-liter gasoline engine and an electric motor. The Prius got an EPA-estimated 45 mpg in the city and 47 mpg on the highway.
Second Generation (2003-2009)
The second generation Prius was introduced in 2003. This generation came with a hatchback design and was larger than its predecessor. It featured improved fuel efficiency and battery technology. It had a more aerodynamic design and a more powerful hybrid system. The Prius got an EPA-estimated 50 mpg in the city and 49 mpg on the highway.
Third Generation (2009-2015)
The third generation Prius was introduced in 2009. It had a more refined design and a more efficient hybrid system. The Prius got an EPA-estimated 51 mpg in the city and 48 mpg on the highway. It had a more aerodynamic design and offered further improvements in fuel economy and technology. Toyota also introduced the larger Prius v and the smaller Prius c during this period.
Fourth Generation (2015-2022)
The fourth generation Prius was introduced in 2015. It had a more angular design and a more advanced hybrid system. The Prius got an EPA-estimated 52 mpg in the city and 50 mpg on the highway. This generation introduced the Toyota New Global Architecture (TNGA) platform, which improved handling and safety. The design was again revamped, and the efficiency of the hybrid system was further optimized.
Fifth Generation (2022 – Present)
The fifth generation Prius was introduced in 2022. It has a more streamlined design and a more powerful hybrid system. The Prius gets an EPA-estimated 54 mpg in the city and 50 mpg on the highway.


Inspiring quest there. What occurred after? Take care!
My web-site – minecraft for free