Toyota FJ Cruiser
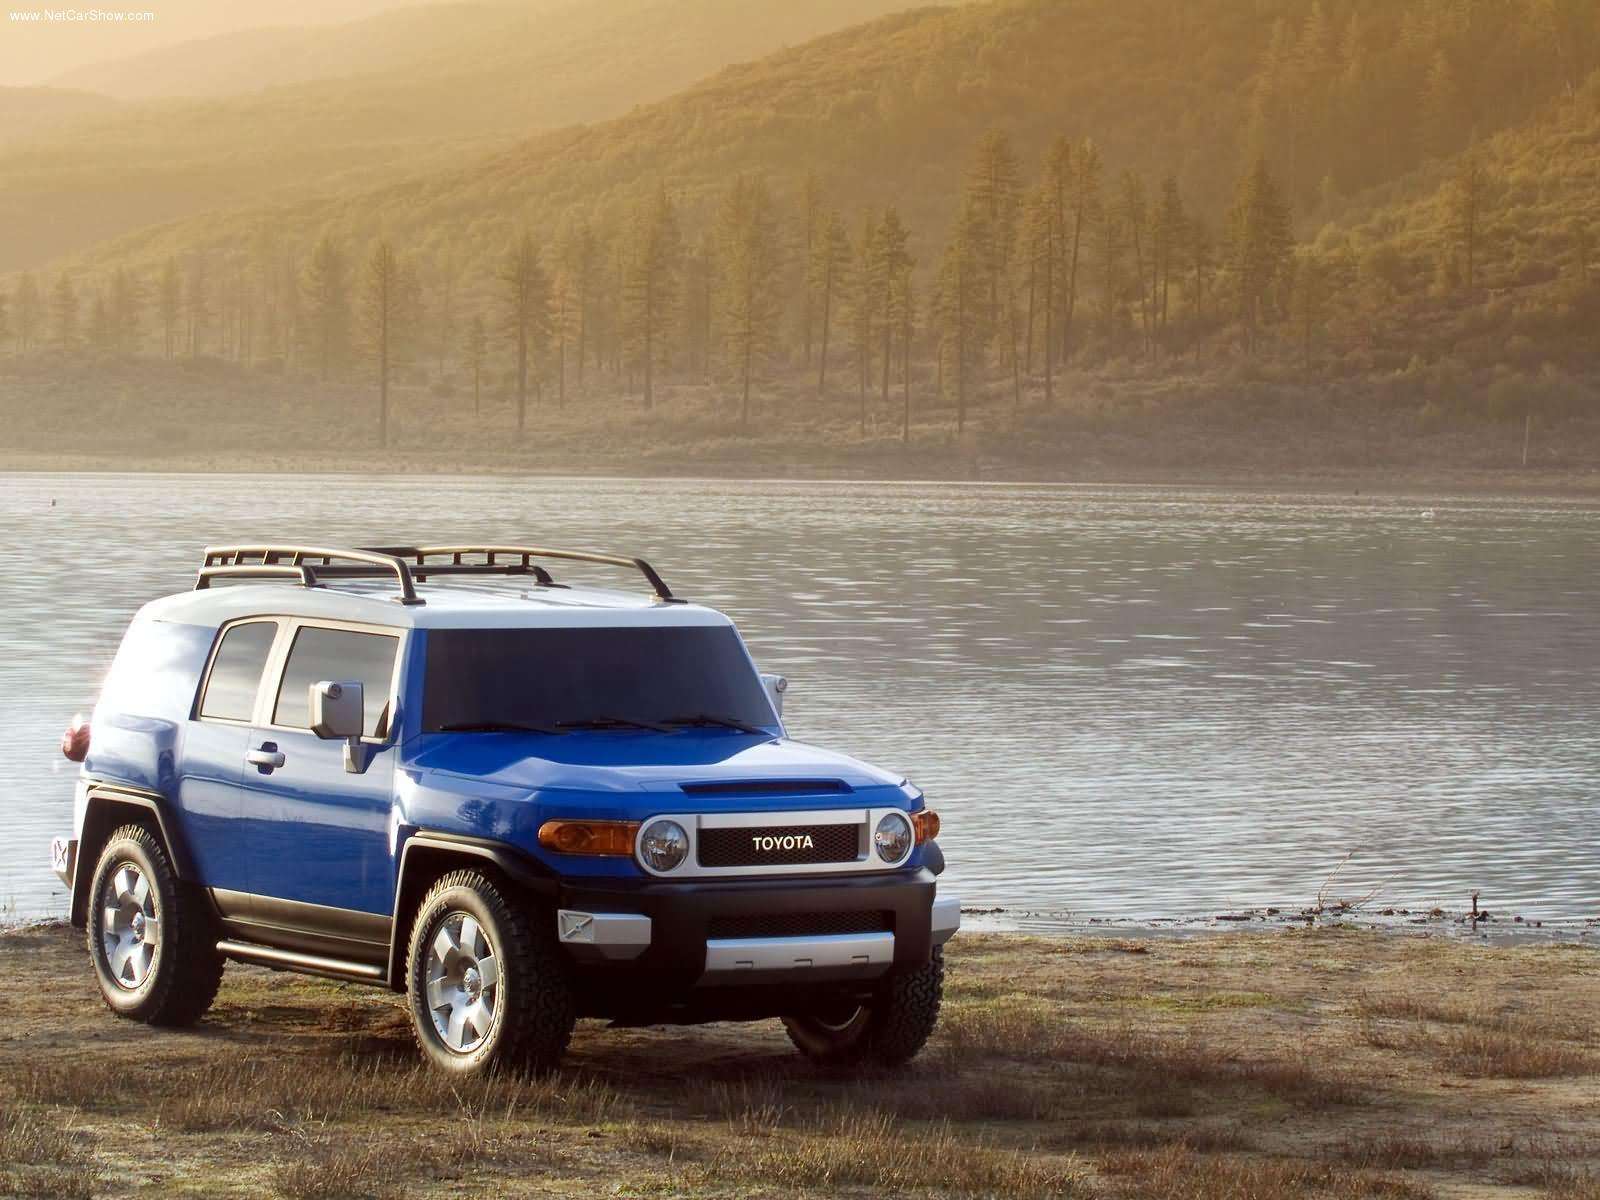
Here you will find Canadian and U.S. sales figures for the Toyota FJ Cruiser. The Toyota FJ Cruiser is a retro-style, mid-size SUV produced by Toyota, inspired by Toyota’s iconic Land Cruiser FJ40 from the 1960s. Its distinctive design, rugged off-road capabilities, and functionality made it a popular choice among off-road enthusiasts. The Toyota FJ Cruiser represents a blend of retro design and modern off-road capability. While it may have lacked some everyday practicalities, its distinctive appearance and rugged performance earned it a special place in the hearts of off-road enthusiasts and contributed to its lasting appeal.
Toyota FJ Cruiser Overview
The FJ Cruiser was first introduced as a concept vehicle at the 2003 North American International Auto Show. Its positive reception led Toyota to move forward with production, and the FJ Cruiser went on sale as a 2007 model year vehicle. The production lasted until 2014 for the United States and continued until 2018 for some other markets.
The design of the FJ Cruiser harkened back to the classic FJ40 Land Cruiser, with a nearly vertical windshield, white roof (on most models), round headlights, and a rugged overall appearance. Underneath its retro-inspired design, the FJ Cruiser was built on a truck-based platform, sharing underpinnings with the Toyota 4Runner and Land Cruiser Prado. The interior was functional, with water-resistant seats and rubberized flooring in some models for easy cleaning after off-road adventures.
The FJ Cruiser was powered by a 4.0-liter V6 engine, offering a good balance of power and efficiency. It was available with either a 5-speed automatic or a 6-speed manual transmission. Off-road prowess was a significant part of the FJ Cruiser’s appeal. With features like good ground clearance, a robust suspension setup, available four-wheel drive with a low-range transfer case, and an optional locking rear differential, it was well-equipped for trails and rough terrain.
Toyota FJ Cruiser Sales Data & Trends
While the FJ Cruiser gained a dedicated following, particularly among off-road enthusiasts, it faced challenges like limited rear visibility and access to the back seats. These aspects limited its appeal as a practical daily driver for some consumers.
Toyota FJ Cruiser U.S Sales Data & Charts
U.S Annual Sales
| Year | Sales Units |
|---|---|
| 2006 | 56,225 |
| 2007 | 55,170 |
| 2008 | 28,668 |
| 2009 | 11,941 |
| 2010 | 14,959 |
| 2011 | 13,541 |
| 2012 | 13,655 |
| 2013 | 13,131 |
| 2014 | 11,726 |
| 2015 | 229 |
| 2016 | 9 |
| 2017 | 3 |
| 2018 | 3 |
| 2019 | 1 |
| 2021 | 1 |
U.S Annual Growth
Toyota FJ Cruiser Canada Sales Data & Charts
Canada Annual Sales
| Year | Sales Units |
|---|---|
| 2012 | 726 |
| 2013 | 656 |
| 2014 | 542 |
| 2015 | 8 |