Subaru Outback
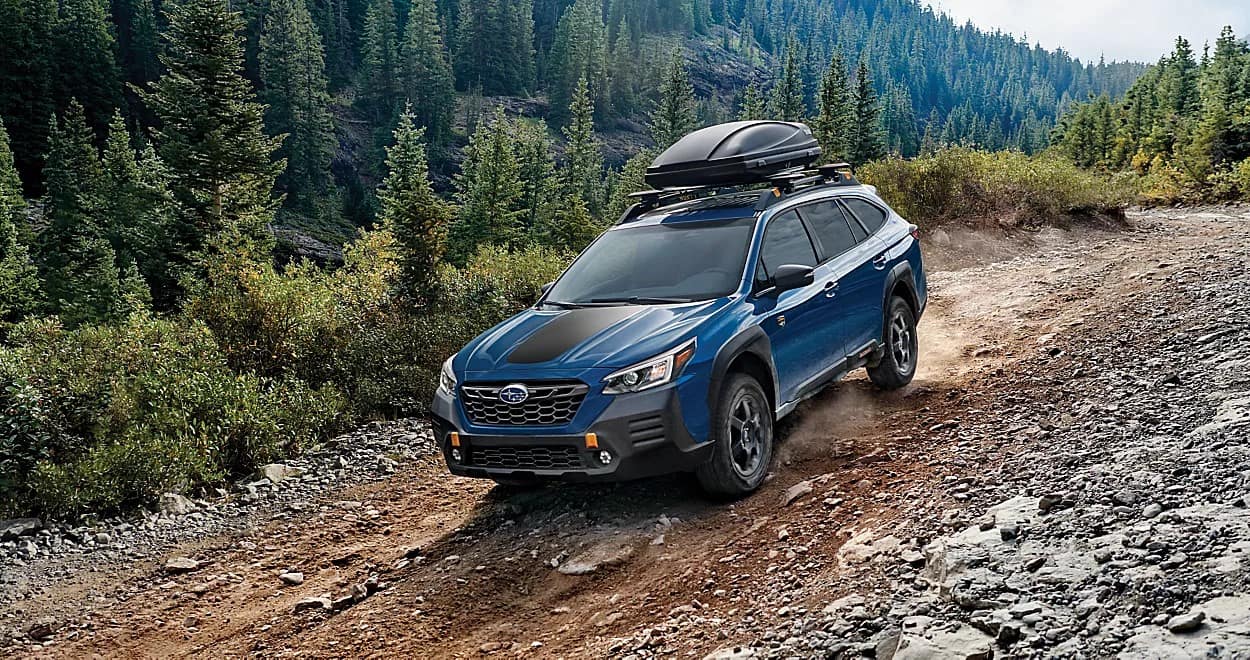
Here you will find Canadian and U.S. sales figures for the Subaru Outback. The Subaru Outback is a mid-size SUV produced by Subaru. It is available in both traditional and Wilderness trims. It has been in production since 1994.
Subaru Outback Overview
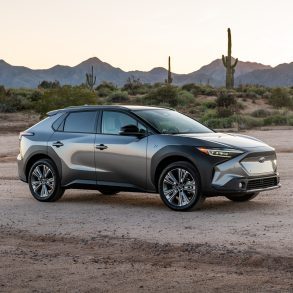
The Subaru Outback is a crossover SUV manufactured by Subaru, offering a blend of car-like driving dynamics with SUV capability and utility. Known for its rugged design, standard all-wheel drive, and solid build quality, the Outback has become one of Subaru’s most popular models, especially among those who seek an adventurous, outdoor-oriented lifestyle.
One of the defining features of the Outback is Subaru’s Symmetrical All-Wheel Drive system, standard on all models, providing excellent traction in various driving conditions. With generous ground clearance and features like X-MODE, which optimizes traction and stability control for off-road conditions, the Outback is well-suited for light off-road adventures.
Subaru Outback Sales Data & Trends
The Subaru Outback represents a unique niche in the automotive market, bridging the gap between station wagons and SUVs. Its combination of car-like driving characteristics with off-road capabilities and SUV-like utility has made it a standout choice for those seeking a well-rounded, adventurous vehicle. The Outback’s focus on safety, technology, and value ensures its continued popularity in the competitive crossover segment. The Outback is a popular car for families and outdoor enthusiasts. It is also a popular car for those who need a car that can handle both on-road and light off-road driving.
Subaru Outback U.S Sales Data & Charts
U.S Monthly Sales
U.S Annual Sales
| Year | Sales Units |
|---|---|
| 2010 | 93,148 |
| 2011 | 104,085 |
| 2012 | 120,264 |
| 2013 | 118,049 |
| 2014 | 138,790 |
| 2015 | 152,294 |
| 2016 | 182,898 |
| 2017 | 188,886 |
| 2018 | 178,854 |
| 2019 | 181,178 |
| 2020 | 153,290 |
| 2021 | 154,623 |
| 2022 | 147,262 |
| 2023 | 161,812 |
| 2024 | 35,213 |
U.S Annual Growth
Subaru Outback Canada Sales Data & Charts
Canada Annual Sales
| Year | Sales Units |
|---|---|
| 2012 | 7,049 |
| 2013 | 6,120 |
| 2014 | 8,688 |
| 2015 | 9,992 |
| 2016 | 11,255 |
| 2017 | 11,490 |
| 2018 | 10,954 |
| 2019 | 10,972 |
| 2020 | 12,556 |
| 2021 | 11,264 |
| 2022 | 5,838 |
Canada Annual Growth
Subaru Outback Generations
1st Generation (1994–1999)
Introduced in 1994 as a derivative of the Subaru Legacy wagon, the first-generation Outback featured raised suspension, protective body cladding, and an emphasis on off-road ability. It was marketed as the “world’s first sport-utility wagon.”
2nd Generation (2000–2004)
The second-generation Outback continued to build on the success of the original, with improved comfort, safety features, and engine options. This generation solidified the Outback’s position as a practical alternative to traditional SUVs.
3rd Generation (2005–2009)
With the third generation, the Outback grew in size and refinement. More advanced technology, better interior materials, and a broader range of options marked this evolution.
4th Generation (2010–2014)
The fourth-generation Outback offered sleeker styling, improved fuel efficiency, and more sophisticated all-wheel-drive systems. The model continued to appeal to those seeking a versatile and rugged vehicle.
5th Generation (2015–2019)
A comprehensive redesign characterized the fifth generation, with more interior space, updated technology, and a new focus on on-road comfort without sacrificing off-road capability.
6th Generation (2020–Present)
The latest generation of the Outback is built on Subaru’s Global Platform, offering improvements in safety, stability, and comfort. It introduced features like a large tablet-style infotainment screen and an available turbocharged engine.