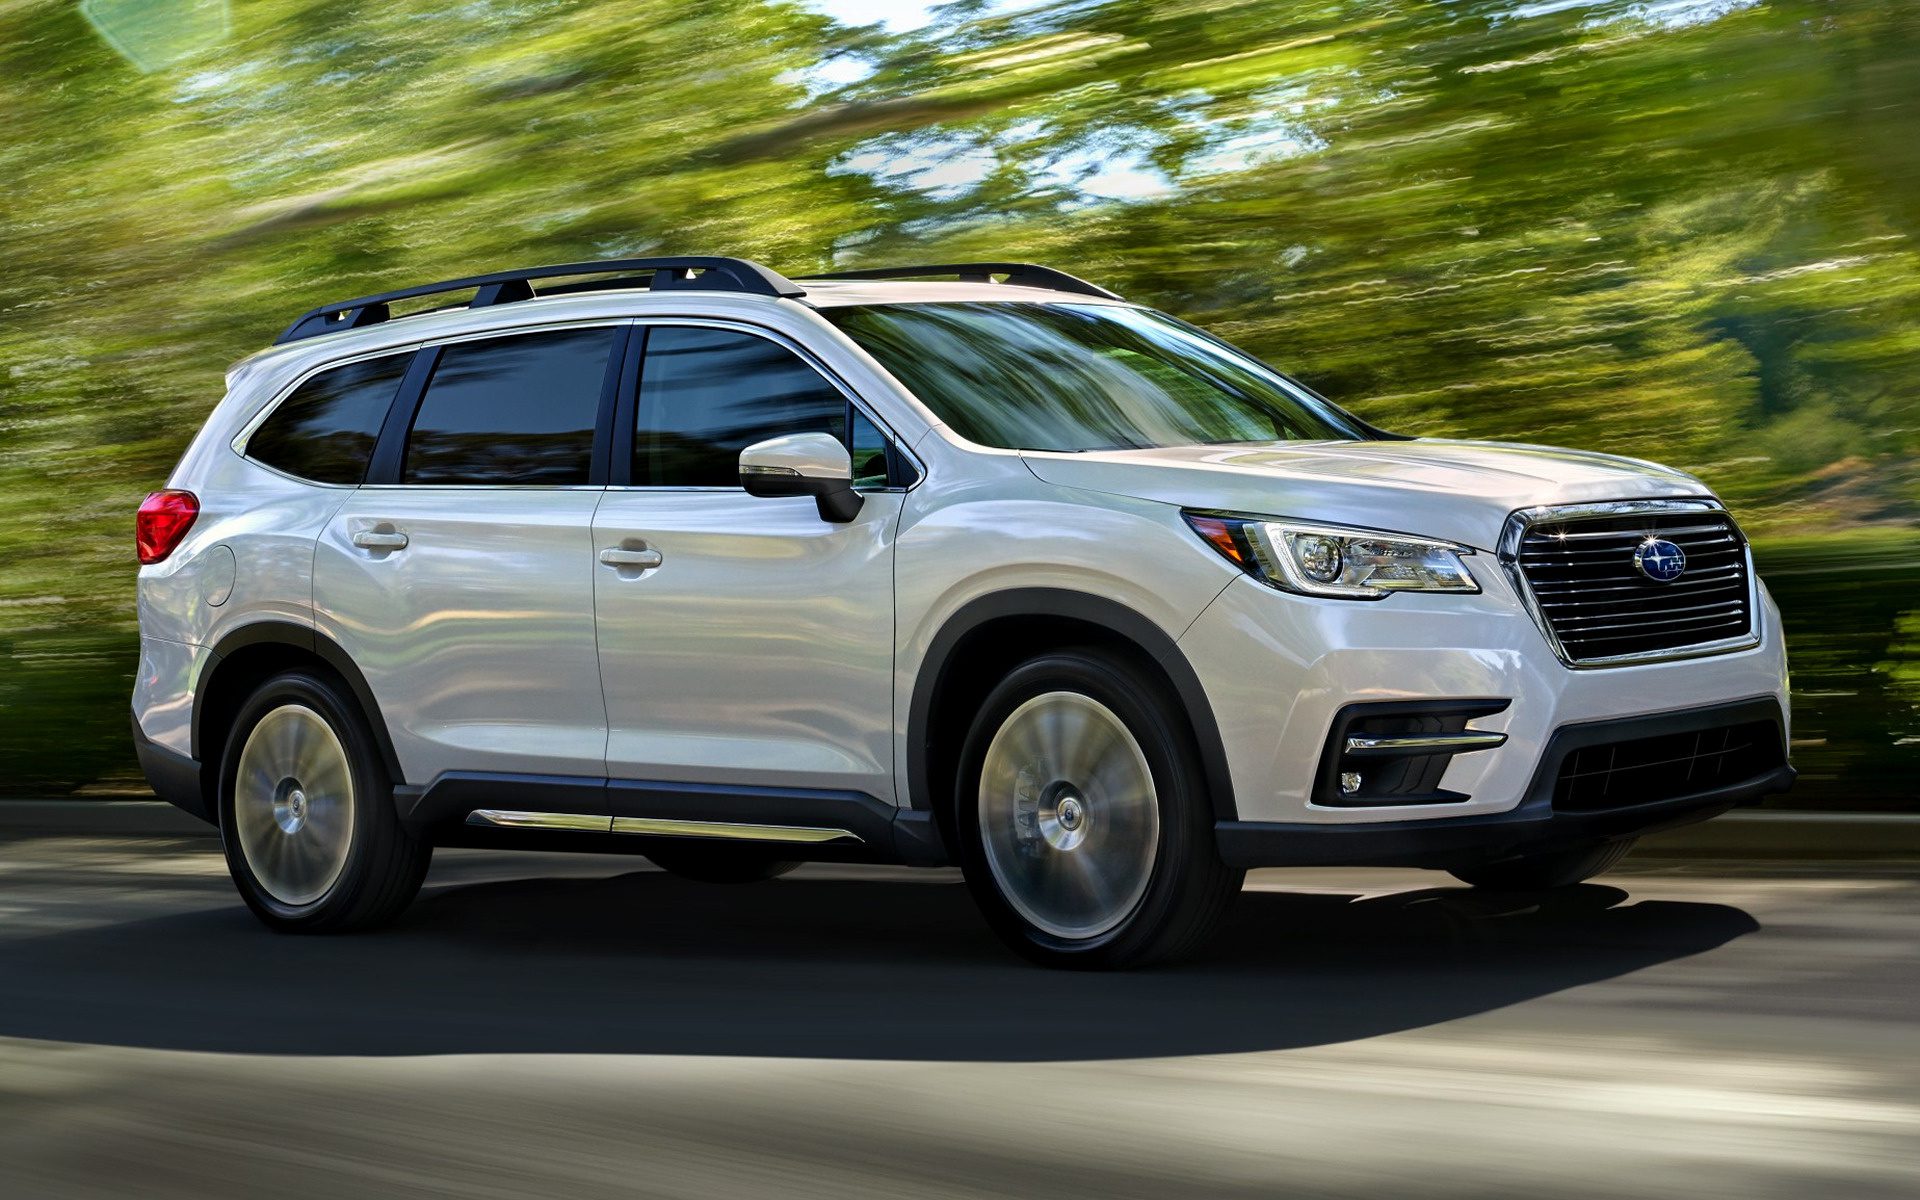
Subaru Ascent
The Ascent is Subaru’s second attempt at a real crossover, after the unsuccessful Tribeca (2006-2014 Model Years). The Subaru Ascent is a mid-size SUV produced by Subaru since 2018. It is the largest SUV that Subaru has ever produced and is available in seven-passenger and eight-passenger configurations.
The Ascent is powered by a 2.4-liter turbocharged four-cylinder engine that produces 260 horsepower and 277 lb-ft of torque. It is mated to a continuously variable transmission (CVT). The Ascent is a good choice for families who need a spacious and comfortable SUV with all-wheel drive. It is also a good choice for those who need an SUV that can handle light off-road driving.
Subaru Ascent U.S Sales Data & Charts
U.S Monthly Sales
U.S Annual Sales
| Year | Sales Units |
|---|---|
| 2008 | 11,968 |
| 2009 | 6,298 |
| 2010 | 25 |