
Smart Fortwo Electric Drive
The Smart Fortwo Electric Drive is a battery electric vehicle (BEV) version of the Smart Fortwo city car. It was introduced in 2007 and is currently in its third generation.
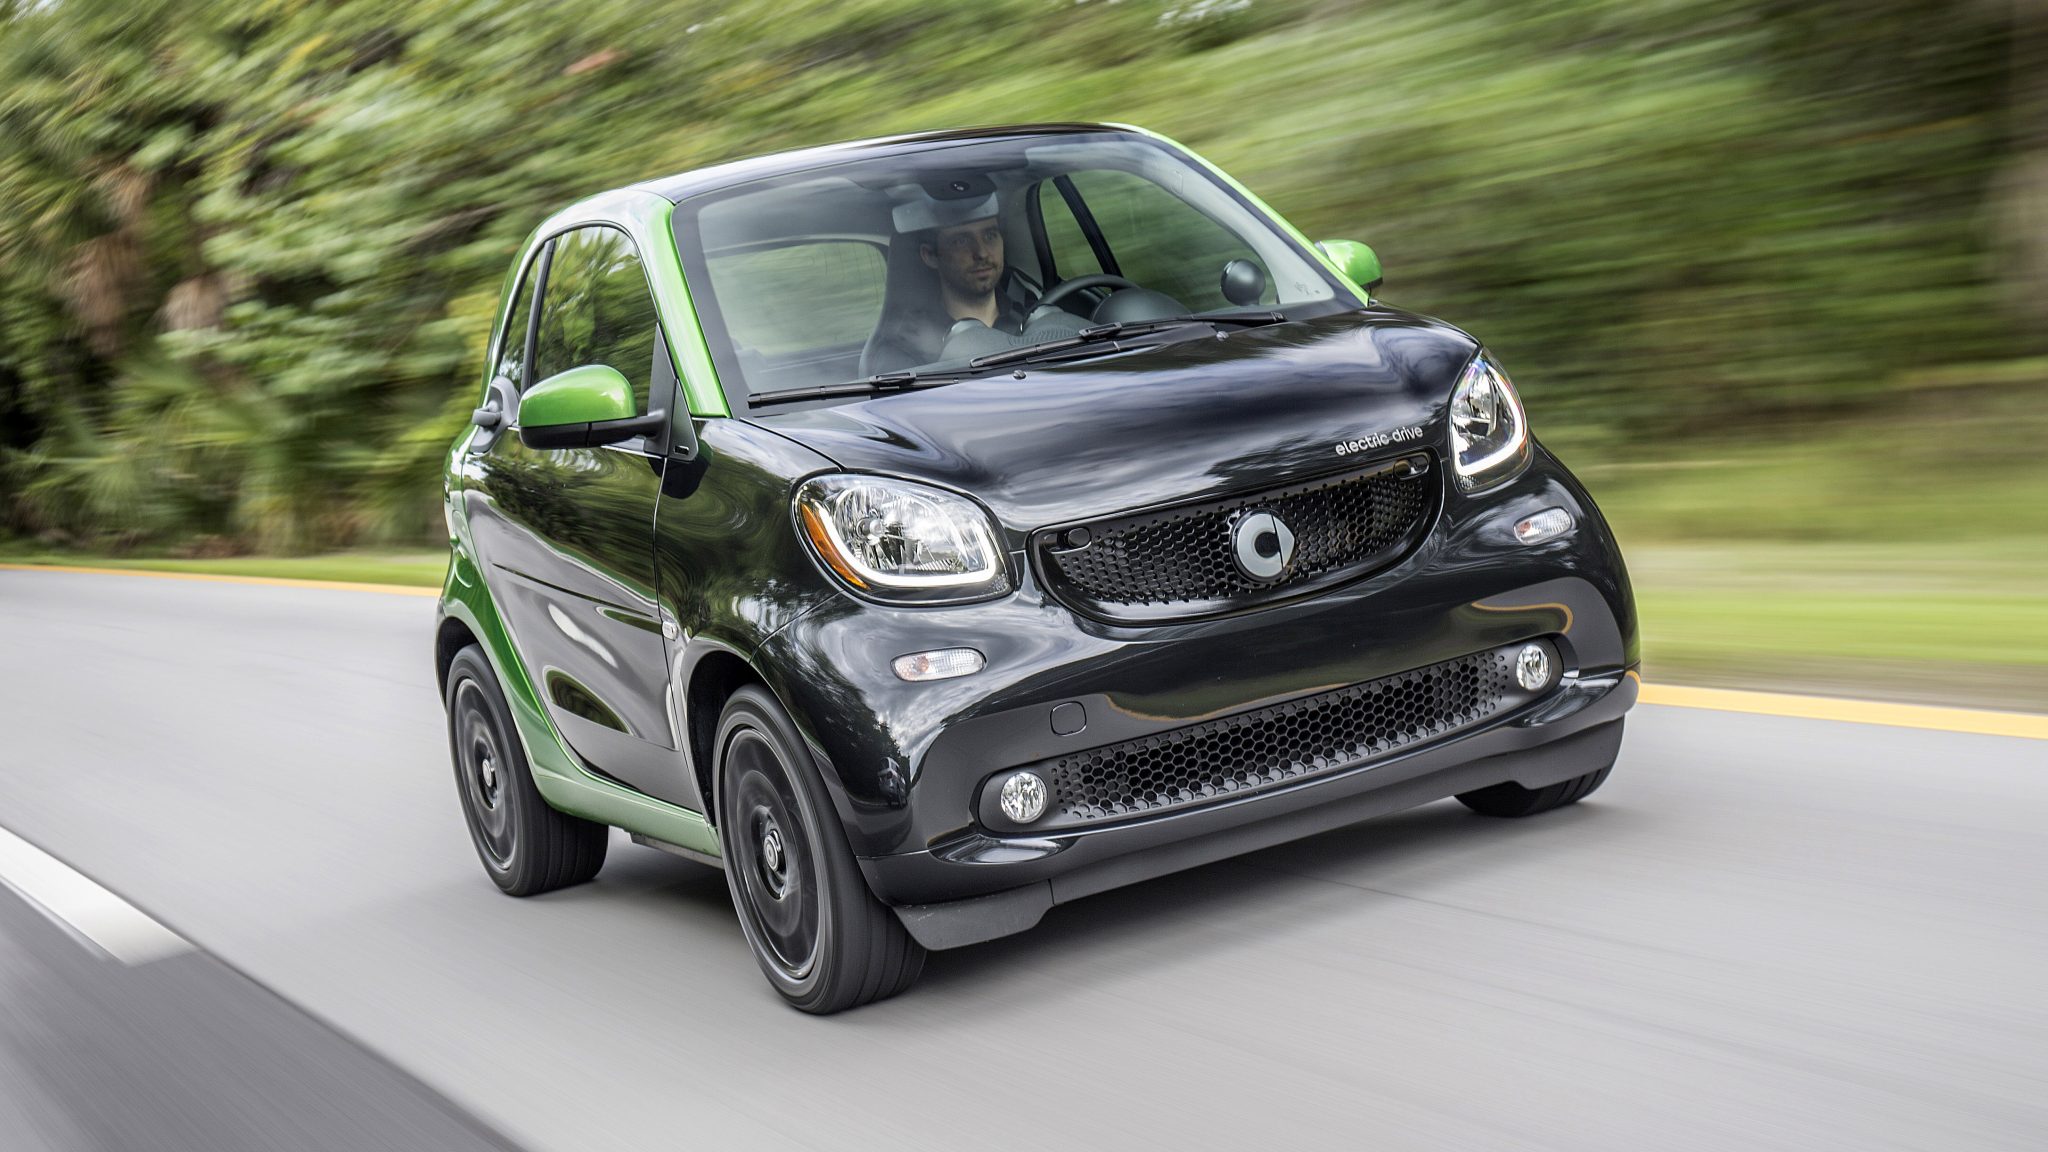
Smart Fortwo Electric Drive Overview
The Smart Fortwo Electric Drive is powered by a 17.6 kWh lithium-ion battery that provides a range of up to 80 miles (129 km) on a single charge. It can be charged from a 220-volt outlet in about 3 hours. The Smart Fortwo Electric Drive is available in both coupé and cabriolet body styles. It is also available in a number of special editions, such as the Prime and the Passion. The Smart Fortwo Electric Drive is a popular car in Europe and is also sold in other markets around the world. It is known for its compact size, fuel efficiency, and zero-emissions driving.
Smart Fortwo Electric Drive Sales Figures
Smart Fortwo Electric Drive US Sales Data & Charts
Europe Annual Sales
| Year | Sales Units |
|---|---|
| 2013 | 923 |
| 2014 | 2,594 |
| 2015 | 1,387 |
| 2016 | 657 |
| 2017 | 544 |
| 2018 | 1,219 |
| 2019 | 680 |


