
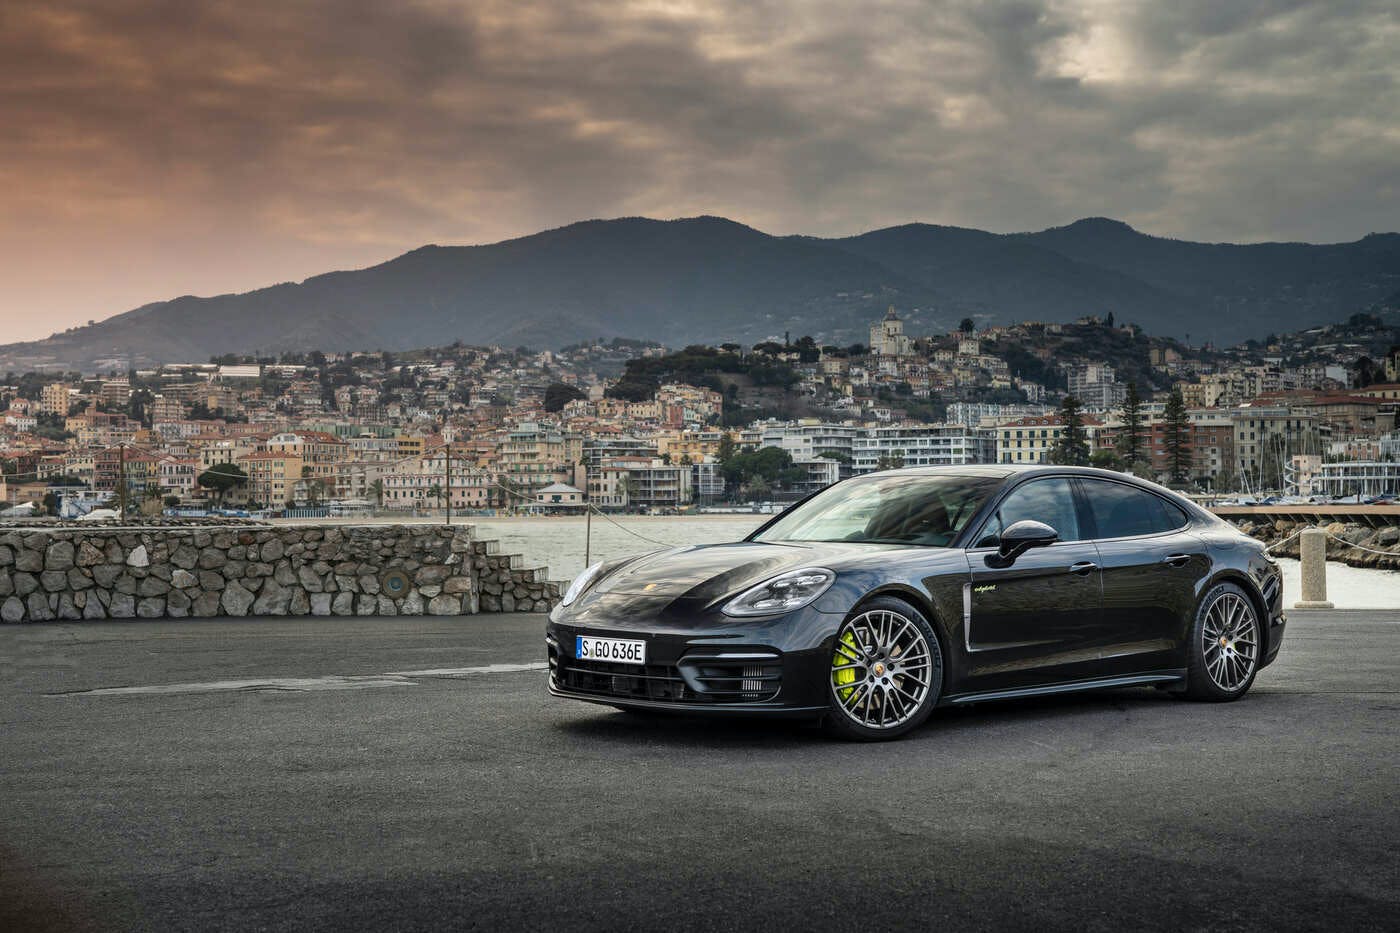
Porsche Panamera
Here you will find monthly and yearly Canadian, European and U.S. sales figures for the Porsche Panamera. The Porsche Panamera is a four-door sports sedan manufactured by Porsche AG. It was introduced in 2009.
Porsche Panamera Overview
The Panamera is available in a variety of models, including the Panamera, Panamera S, Panamera GTS, Panamera Turbo, and Panamera Turbo S E-Hybrid. The Panamera is powered by a variety of engines, including a 3.0-liter turbocharged V6 engine, a 4.0-liter twin-turbocharged V8 engine, and a 4.0-liter twin-turbocharged V8 hybrid engine.
It is available with a choice of rear-wheel drive or all-wheel drive. The Panamera has a top speed of 190 mph and can accelerate from 0 to 60 mph in 4.4 seconds. It is available with a variety of features, including Porsche Active Suspension Management (PASM), Porsche Torque Vectoring Plus (PTV Plus), and Porsche Dynamic Chassis Control (PDCC). The Panamera has been praised for its handling, performance, and luxury features. It has won numerous awards, including the 2010 Motor Trend Car of the Year.
Porsche Panamera Sales Figures
Porsche Panamera U.S Sales Data & Charts
US Monthly Sales
US Annual Sales
| Year | Sales Units |
|---|---|
| 2010 | 7,741 |
| 2011 | 6,879 |
| 2012 | 7,614 |
| 2013 | 5,421 |
| 2014 | 5,740 |
| 2015 | 4,985 |
| 2016 | 4,403 |
| 2017 | 6,731 |
| 2018 | 8,114 |
| 2019 | 6,625 |
| 2020 | 3,871 |
| 2021 | 3,555 |
| 2022 | 4,226 |
| 2023 | 4,197 |
| 2024 | 523 |
US Annual Growth
Porsche Panamera Canada Sales Data & Charts
Canada Annual Sales
| Year | Sales Units |
|---|---|
| 2012 | 422 |
| 2013 | 328 |
| 2014 | 375 |
| 2015 | 341 |
| 2016 | 300 |
| 2017 | 559 |
| 2018 | 783 |
| 2019 | 539 |
| 2020 | 268 |
| 2021 | 305 |
Canada Annual Growth
Porsche Panamera Europe Sales Data & Charts
Europe Annual Sales
| Year | Sales Units |
|---|---|
| 2008 | 88 |
| 2009 | 2,742 |
| 2010 | 6,563 |
| 2011 | 7,363 |
| 2012 | 7,543 |
| 2013 | 5,679 |
| 2014 | 5,676 |
| 2015 | 4,191 |
| 2016 | 3,140 |
| 2017 | 10,478 |
| 2018 | 9,454 |
| 2019 | 8,436 |
| 2020 | 4,308 |
| 2021 | 5,097 |
| 2022 | 5,062 |


The Panamera is one damn good car despite what some auto magazines remark about it. They mostly dislike the hindquarters of the car because it has a convenient hatch. That means that it can serve as a station wagon if it needs to be. I think the car looks muscular in profile. It handles better than many so-called sports cars and in Turbo S form can beat the tires off many super sports cars. I would love one.
Bruce Madeley
Sycame, Illinois