Porsche Macan
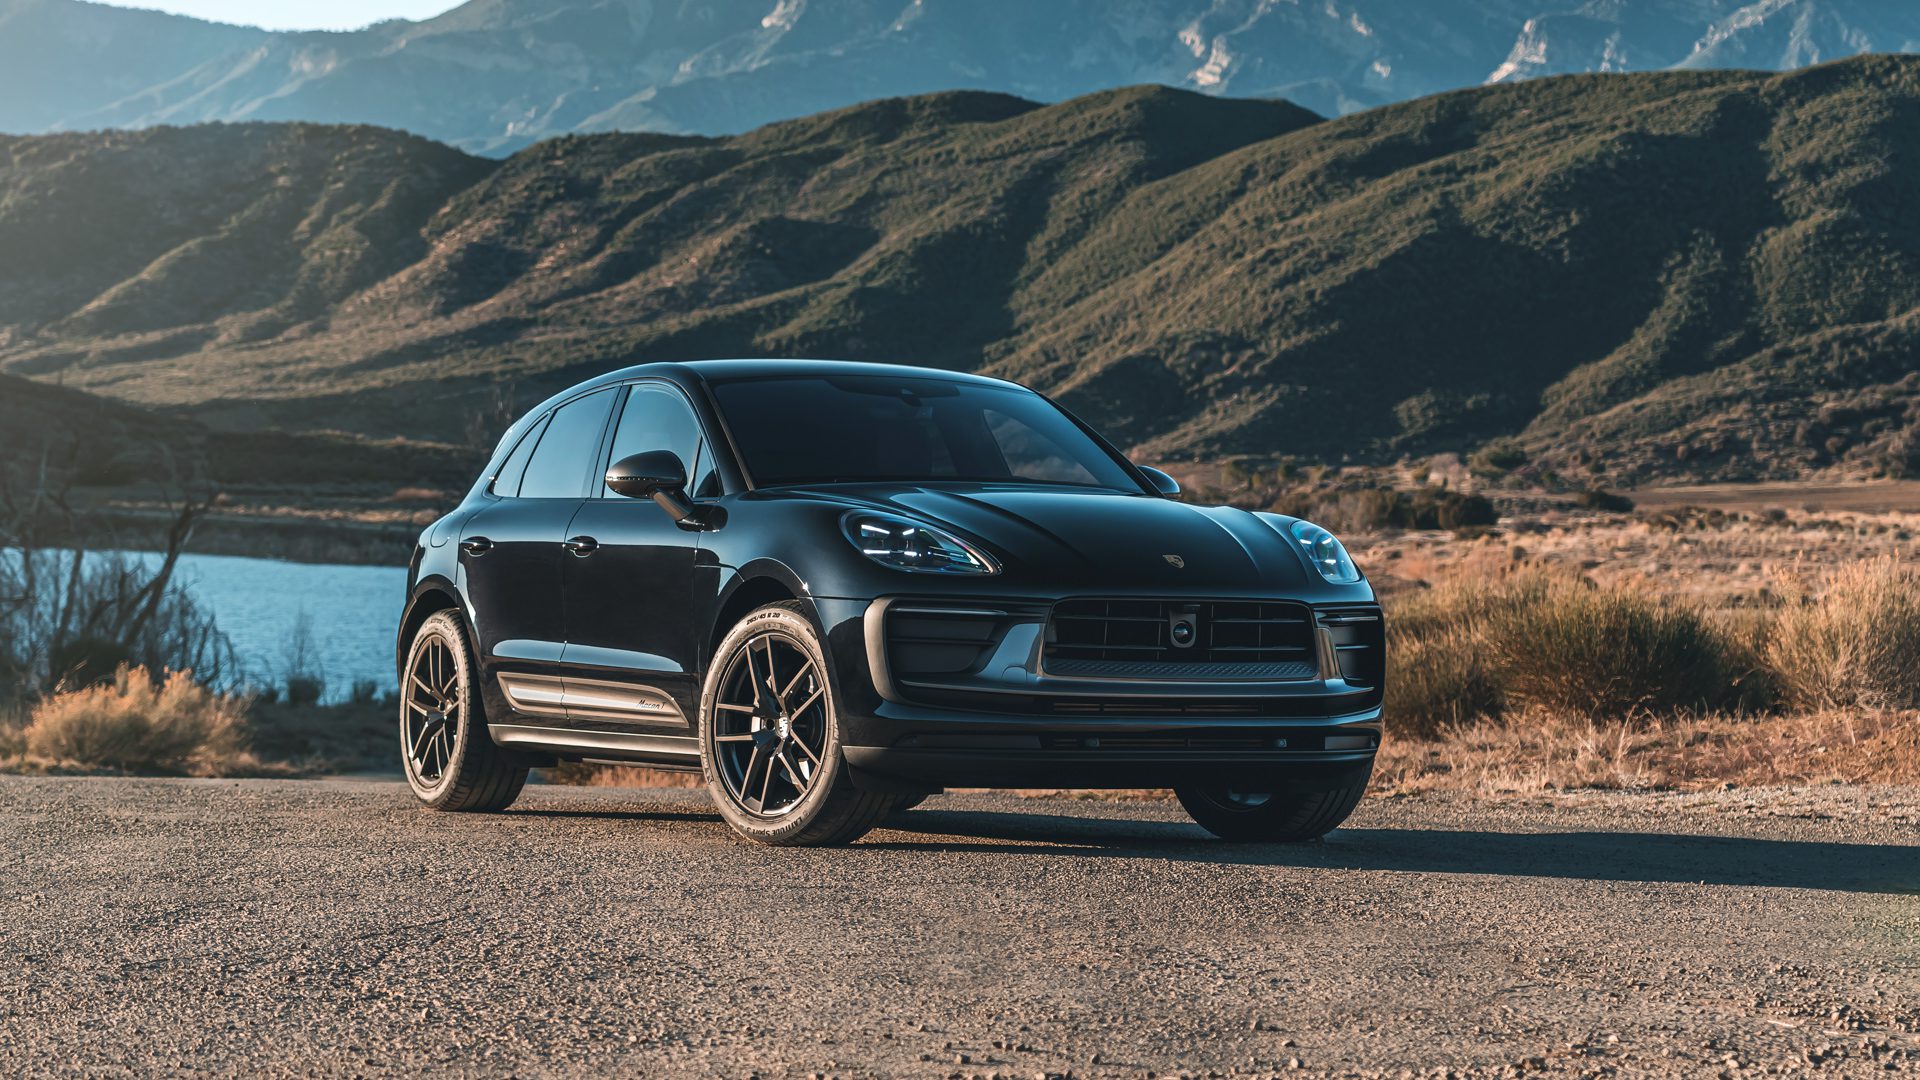
Here you will find monthly and yearly Porsche Macan sales figures from the United States, European and Canada. The Porsche Macan is a luxury compact SUV introduced by the German automaker Porsche in 2014. The Macan’s introduction marked Porsche’s further expansion into the growing SUV segment, following the larger Cayenne’s success. Despite initial skepticism from enthusiasts about Porsche entering the compact SUV market, the Macan quickly became a best-seller for the brand.
Porsche Macan Overview
The Macan is based on the same platform as the first-generation Audi Q5, known as the MLB platform. However, Porsche made significant modifications to suit the brand’s sporty pedigree. Emphasizing Porsche’s sportscar DNA, the Macan offers a range of powerful engines, including turbocharged four-cylinder and V6 options. Over the years, there have been variants such as the Macan S, Macan GTS, and Macan Turbo, each with varying performance levels. The Macan is often praised for its sporty handling, distinguishing it from many competitors in the compact SUV segment. It brings a level of driving engagement rare for its class. The Macan has seen updates and facelifts since its initial introduction, with improvements in design, technology, and performance.
In summary, the Porsche Macan represents the brand’s successful foray into the luxury compact SUV market, merging the practicality and appeal of SUVs with the performance and luxury that Porsche is known for. Its introduction and subsequent success underline the changing landscape of the automotive world, where even storied sports car manufacturers are embracing the SUV format.
Porsche Macan Sales Figures
Porsche Macan US Sales Data & Charts
US Monthly Sales
US Annual Sales
| Year | Sales Units |
|---|---|
| 2014 | 7,241 |
| 2015 | 13,533 |
| 2016 | 19,332 |
| 2017 | 21,429 |
| 2018 | 22,954 |
| 2019 | 22,667 |
| 2020 | 18,633 |
| 2021 | 22,002 |
| 2022 | 23,687 |
| 2023 | 27,400 |
| 2024 | 5,670 |
US Annual Growth
Porsche Macan Canada Sales Data & Charts
Canada Annual Sales
Year Sales Units
2014
1,223
2015
2,121
2016
2,799
2017
3,767
2018
3,960
2019
3,151
2020
2,283
2021
3,656
Canada Annual Growth
Porsche Macan Europe Sales Data & Charts
Europe Annual Sales
| Year | Sales Units |
|---|---|
| 2013 | 134 |
| 2014 | 14,569 |
| 2015 | 23,317 |
| 2016 | 24,904 |
| 2017 | 26,555 |
| 2018 | 19,321 |
| 2019 | 24,469 |
| 2020 | 16,865 |
| 2021 | 15,757 |
| 2022 | 21,592 |