
Nissan Xterra
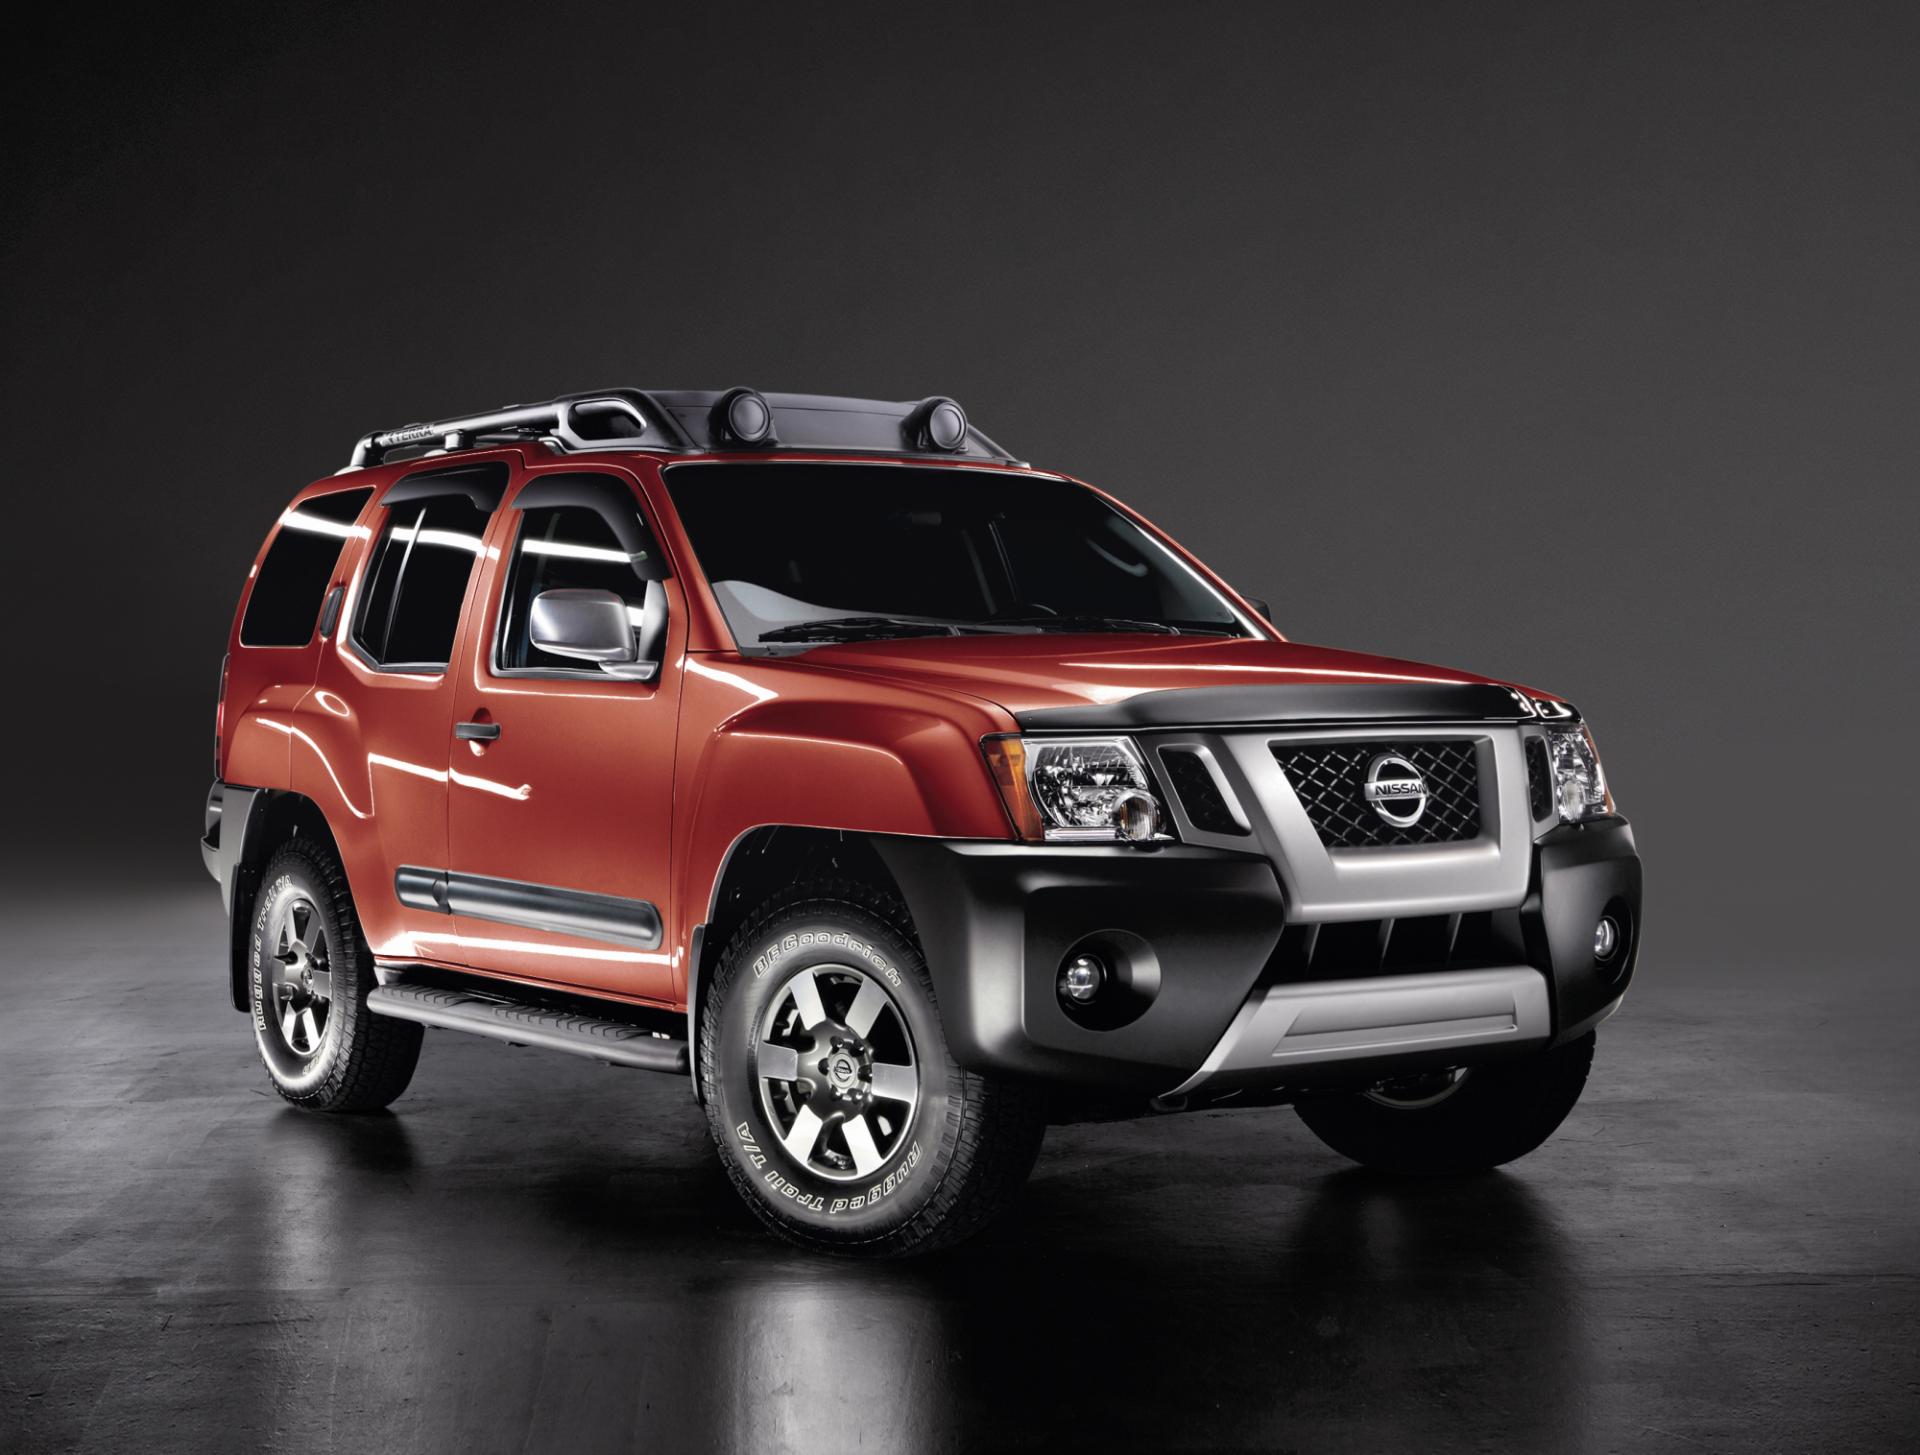
Here you will find monthly and yearly Canadian and U.S. sales figures for the Nissan Xterra. The Nissan Xterra is a mid-size SUV that was in production from 2000 to 2015. It was known for its rugged off-road capabilities and its spacious interior. The Xterra was available in two trim levels: SE and Pro-4X.
The Xterra was powered by a 4.0L V6 engine that produced 261 horsepower and 281 lb-ft of torque. It was mated to a 5-speed automatic transmission. The Xterra was available with rear-wheel drive or four-wheel drive. The Xterra got an EPA-estimated 16 mpg in the city and 22 mpg on the highway. It was not the most fuel-efficient mid-size SUV on the market, but it was still respectable for an off-road vehicle.
The Xterra was not the most spacious mid-size SUV on the market, but it was comfortable for five adults. The cargo space was also decent, with 35.7 cubic feet of space behind the rear seats and 70.2 cubic feet of space with the rear seats folded down. The Xterra was a good choice for people who were looking for a rugged off-road SUV with a spacious interior. It was not the most fuel-efficient or affordable mid-size SUV on the market, but it was still a good value for the price.
Nissan Xterra U.S Sales Data & Charts
| Year | Sales Units |
|---|---|
| 2005 | 73,447 |
| 2006 | 62,325 |
| 2007 | 51,355 |
| 2008 | 33,579 |
| 2009 | 16,455 |
| 2010 | 20,523 |
| 2011 | 18,221 |
| 2012 | 18,679 |
| 2013 | 17,766 |
| 2014 | 16,505 |
| 2015 | 10,672 |
| 2016 | 38 |
| 2017 | 1 |
Nissan Xterra Canada Sales Data & Charts
| Year | Sales Units |
|---|---|
| 2012 | 931 |
| 2013 | 1,070 |
| 2014 | 991 |
| 2015 | 1,707 |
| 2016 | 899 |


April 17th – no March data for xterra sales in Canada?.. 🙂
It's updated now.
Many thanks for the update. And thanks for the great site!!!