
Nissan Quest
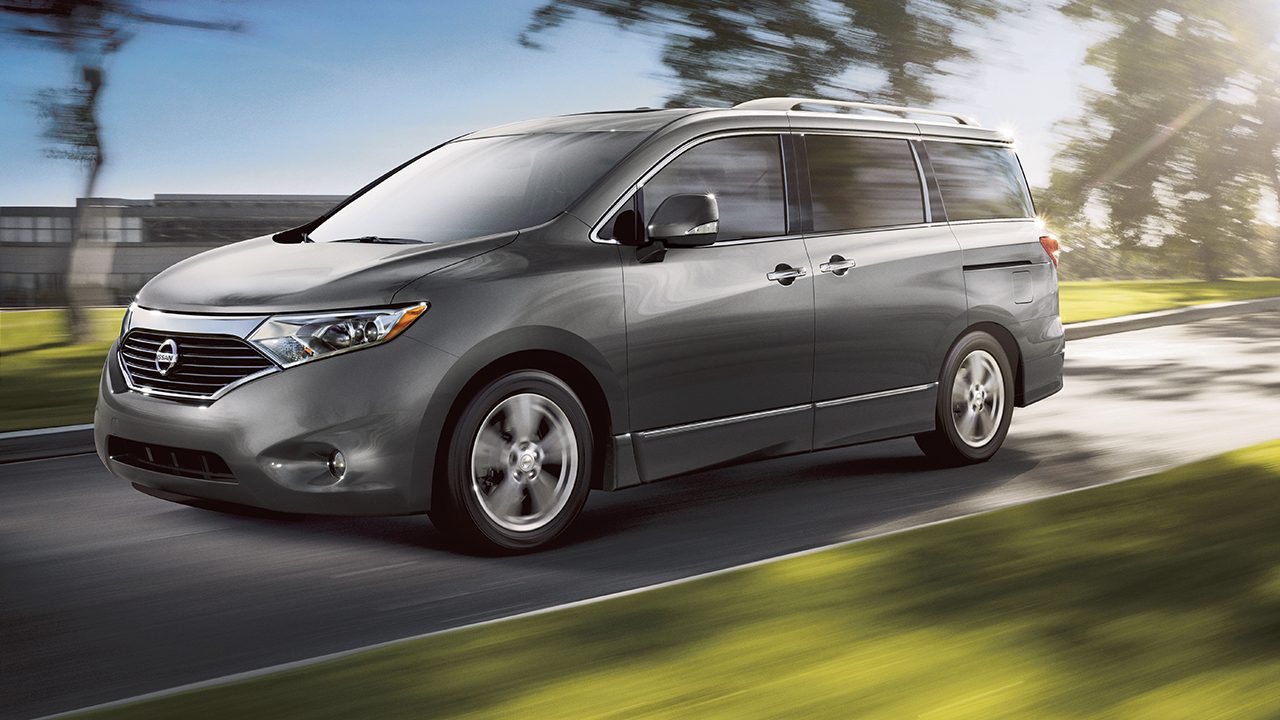
Here you will find sales figures for the Nissan Quest. The Nissan Quest is a minivan that has been in production since 1992. It is currently in its fourth generation, which was introduced in 2017. The Quest is available in one trim level: SL. The Quest is powered by a 3.5L V6 engine that produces 284 horsepower and 259 lb-ft of torque. It is mated to a continuously variable transmission (CVT). The Quest is available with front-wheel drive or all-wheel drive.
The Quest gets an EPA-estimated 18 mpg in the city and 25 mpg on the highway. It is not the most fuel-efficient minivan on the market, but it is still respectable. The Quest is not the most spacious minivan on the market, but it is comfortable for up to 8 passengers. The cargo space is also decent, with 39.3 cubic feet of space behind the third row and 140.3 cubic feet of space with the third row folded down. The Quest is a good choice for people who are looking for a comfortable and reliable minivan. It is not the most fuel-efficient or spacious minivan on the market, but it is still a good value for the price.
Nissan Quest U.S Sales Data & Charts
US Annual Sales
| Year | Sales Units |
|---|---|
| 2005 | 40,357 |
| 2006 | 31,905 |
| 2007 | 28,590 |
| 2008 | 18,252 |
| 2009 | 8,437 |
| 2010 | 177 |
| 2011 | 12,199 |
| 2012 | 19,481 |
| 2013 | 12,874 |
| 2014 | 9,833 |
| 2015 | 11,018 |
| 2016 | 11,115 |
| 2017 | 4,950 |
| 2018 | 3 |
| 2019 | 0 |
| 2020 | 0 |
US Annual Growth
Nissan Quest Canada Sales Data & Charts
Canada Annual Sales
| Year | Sales Units |
|---|---|
| 2012 | 668 |
| 2013 | 662 |
| 2014 | 63 |
| 2015 | 2 |


