
Nissan NV200
Here you will find monthly and yearly Canadian, European, Chinese and U.S. sales figures for the Nissan NV200. The Nissan NV200 is a compact cargo van primarily designed for urban and commercial use. It’s known for its efficiency, maneuverability, and versatility, especially in tight urban settings.
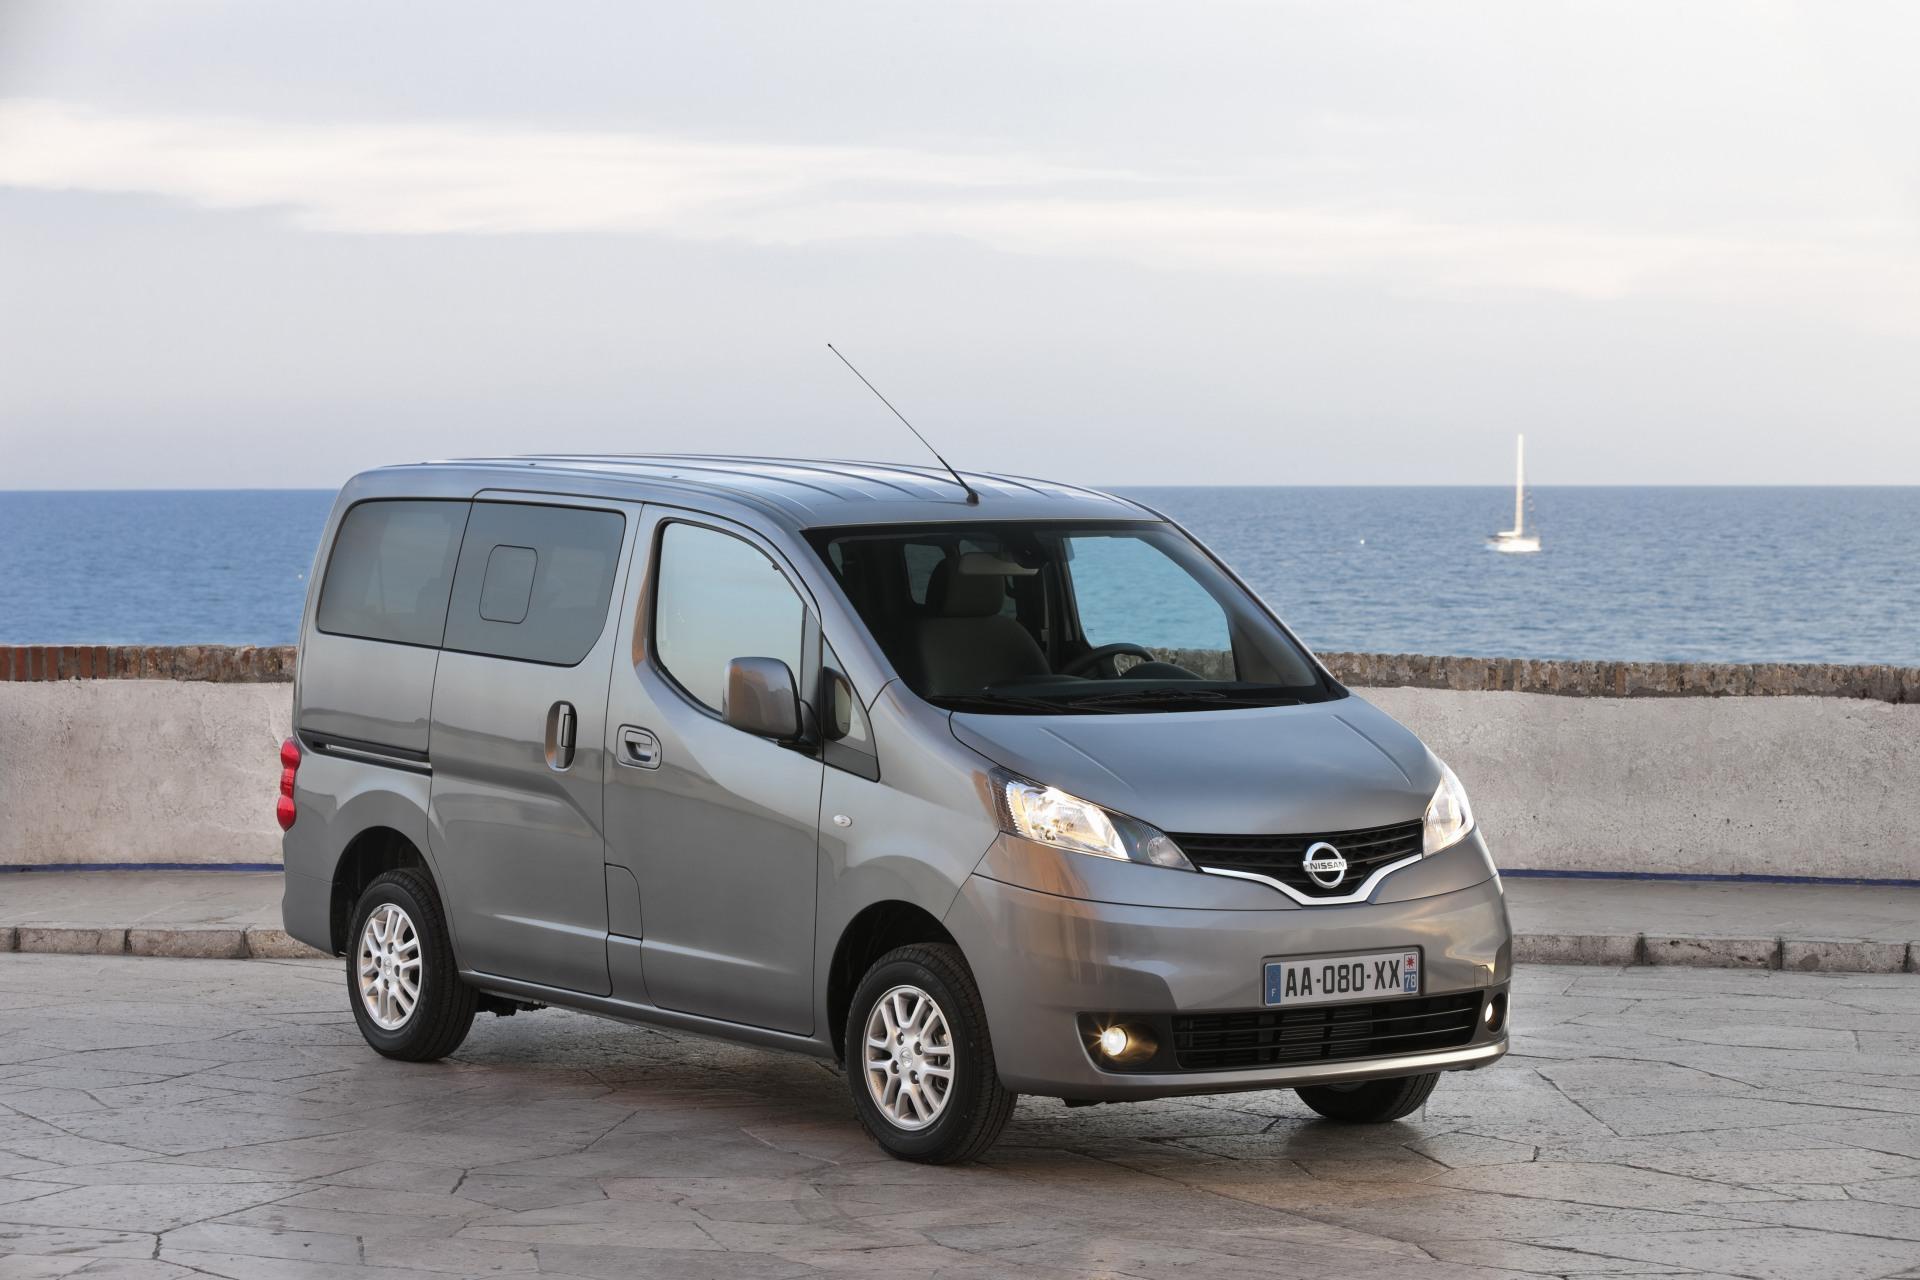
Nissan NV200 Overview
The Nissan NV200 was introduced in 2009 and has since become a popular choice for various businesses around the world, particularly those requiring a small but versatile cargo van. With its compact dimensions, the NV200 is particularly well-suited for city use where larger vehicles might struggle with tight streets and limited parking. However, despite its compact size, the NV200’s interior is designed for maximum utility, with a spacious cargo area and various configurations to suit different business needs.
Historically, the NV200 has been equipped with a 2.0L four-cylinder engine paired with a continuously variable transmission (CVT) in some markets, offering a balance between power and fuel efficiency. Depending on the trim and market, the NV200 comes equipped with features such as a navigation system, backup camera, Bluetooth connectivity, and more. Its cargo area is customizable, with options for shelving, racks, and other organizational tools.
The current NV200 is powered by a 2.0-liter four-cylinder engine that produces 131 horsepower and 144 lb-ft of torque. It is available with either a manual transmission or a CVT automatic transmission. The NV200 is available in two body styles: a cargo van and a passenger van. The cargo van is available in two trim levels: the S and the SV. The S is the base trim level and comes standard with features like a 6-speaker sound system, air conditioning, and power windows. The SV is the mid-level trim level and comes standard with a variety of features, such as a 12-volt power outlet, a rearview camera, and a fold-down front passenger seat.
The passenger van is available in one trim level: the SV. The SV comes standard with features like a 6-speaker sound system, air conditioning, and power windows. The NV200 is a good value for money van. It offers a spacious interior and a variety of features. It is also available in two body styles, so you can choose the one that best suits your needs.
Nissan NV200 Sales Figures
The Nissan NV200 has been generally well-received in its category, especially for businesses that require a compact yet spacious van. Its compact size, combined with its cargo capacity and maneuverability, make it a good choice for urban operations. In the compact van segment, the NV200 competes with vehicles like the Ford Transit Connect, RAM ProMaster City, and the Chevrolet City Express (interestingly, the City Express is essentially a rebadged version of the NV200, resulting from a partnership between Nissan and Chevrolet).
Nissan NV200 U.S Sales Data & Charts
US Annual Sales
| Year | Sales Units |
|---|---|
| 2013 | 4,031 |
| 2014 | 13,385 |
| 2015 | 17,317 |
| 2016 | 18,523 |
| 2017 | 18,602 |
| 2018 | 18,628 |
| 2019 | 18,768 |
| 2020 | 17,126 |
| 2021 | 17,359 |
| 2022 | 134 |
US Annual Growth
Nissan NV200 Canada Sales Data & Charts
Canada Annual Sales
| Year | Sales Units |
|---|---|
| 2013 | 598 |
| 2014 | 1,275 |
| 2015 | 1,343 |
| 2016 | 1,651 |
| 2017 | 1,748 |
| 2018 | 1,700 |
| 2019 | 1,783 |
| 2020 | 1,929 |
| 2021 | 2,871 |
Canada Annual Growth
Nissan NV200 Europe Sales Data & Charts
Europe Annual Sales
| Year | Sales Units |
|---|---|
| 2009 | 38 |
| 2010 | 2,265 |
| 2011 | 4,702 |
| 2012 | 6,366 |
| 2013 | 5,370 |
| 2014 | 5,434 |
| 2015 | 6,288 |
| 2016 | 7,122 |
| 2017 | 6,945 |
| 2018 | 4,858 |
| 2019 | 3,317 |
| 2020 | 1,792 |
| 2021 | 1,226 |
Europe Annual Growth
Nissan NV200 China Sales Data & Charts
China Annual Sales
| Year | Sales Units |
|---|---|
| 2010 | 11,670 |
| 2011 | 15,406 |
| 2012 | 14,958 |
| 2013 | 17,639 |
| 2014 | 18,474 |
| 2015 | 9,403 |
| 2016 | 10,460 |
| 2017 | 8,879 |
| 2018 | 9,181 |
| 2019 | 4,117 |
| 2020 | 25 |


