
Nissan NV
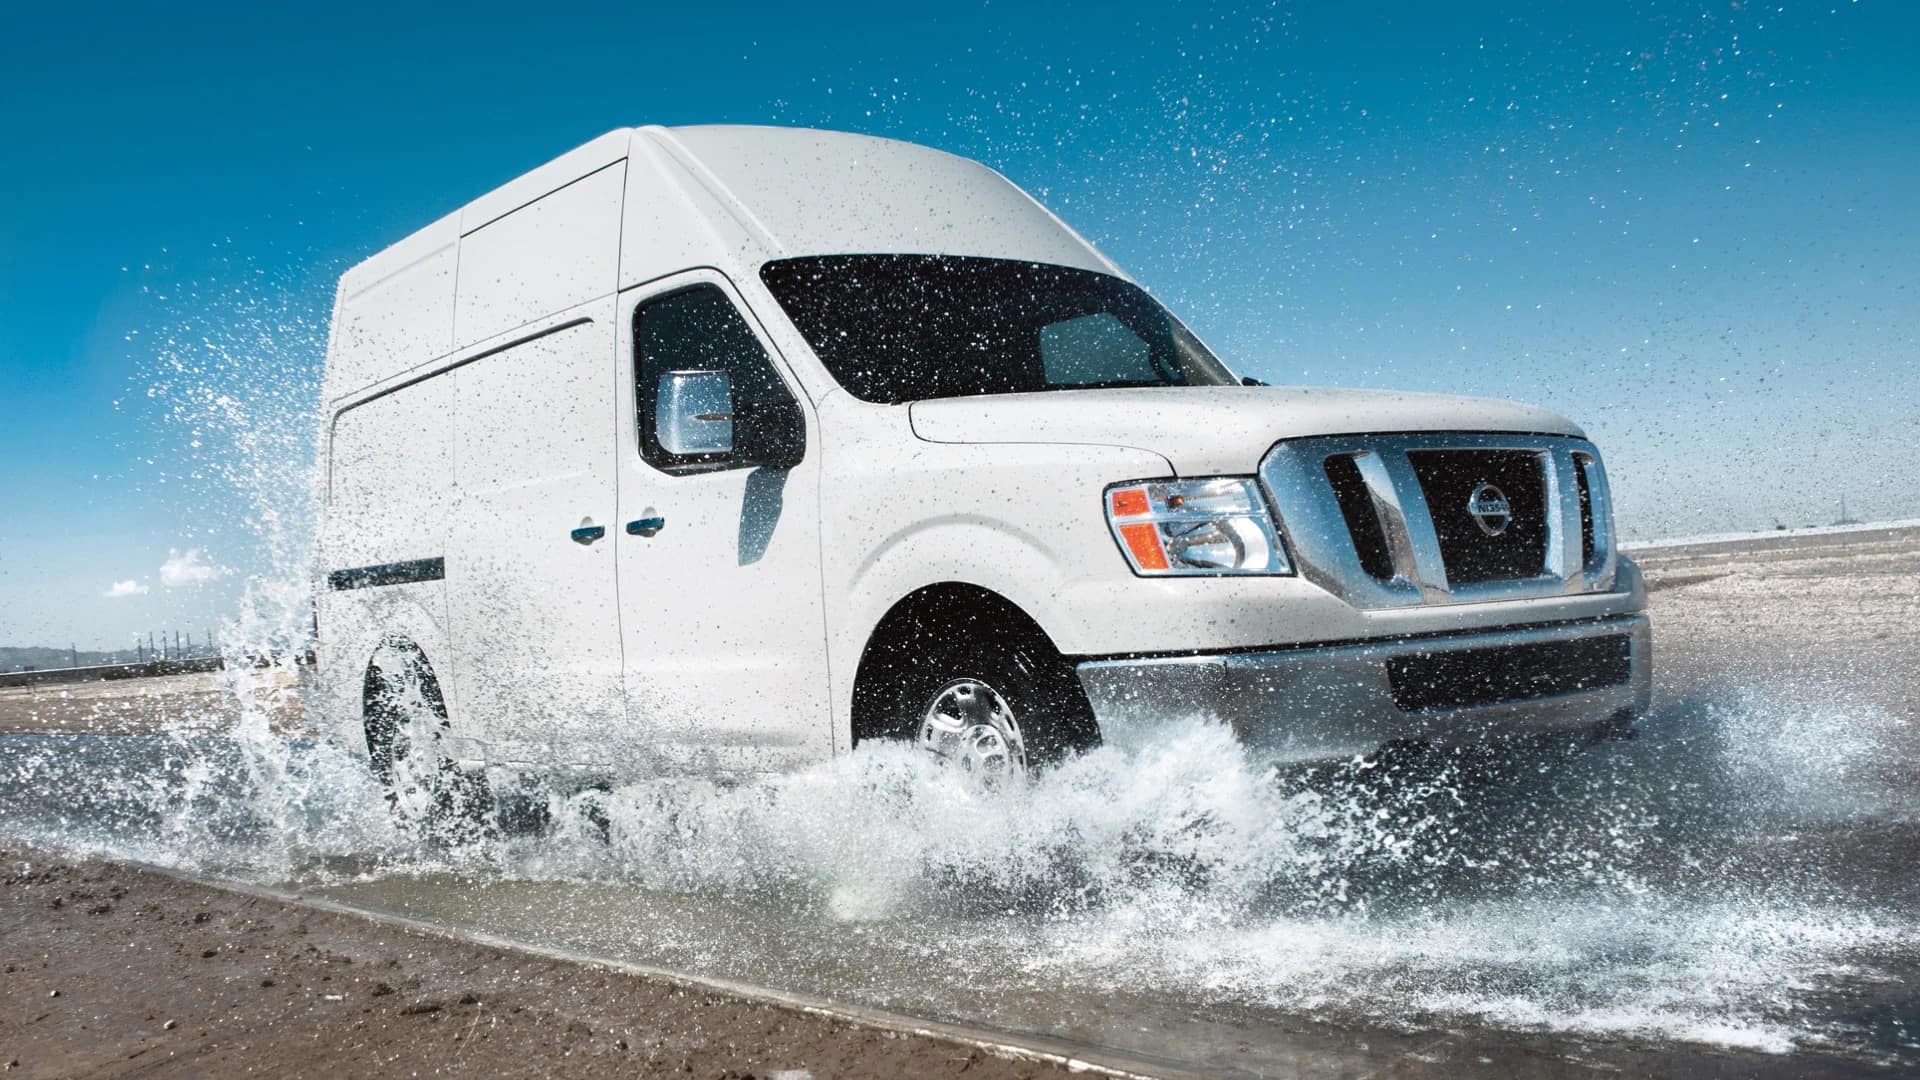
Here you will find sales figures for the Nissan NV. The Nissan NV is a commercial van that has been in production since 2011. It is currently in its second generation, which was introduced in 2017. The NV is available in three body styles: Cargo Van, Passenger Van, and XD.
The NV is powered by a 5.6L V8 engine that produces 310 horsepower and 381 lb-ft of torque. It is mated to a five-speed automatic transmission. The NV is available with rear-wheel drive or four-wheel drive. The NV gets an EPA-estimated 14 mpg in the city and 19 mpg on the highway. It is not the most fuel-efficient commercial van on the market, but it is still respectable.
The NV is not the most spacious commercial van on the market, but it is comfortable for up to 12 passengers in the Passenger Van and up to 15 passengers in the XD. The cargo space is also massive, with 397 cubic feet of space in the Cargo Van and 126.9 cubic feet of space in the XD. The NV is a good choice for people who are looking for a reliable and capable commercial van. It is not the most fuel-efficient or spacious commercial van on the market, but it is still a good value for the price.
Nissan NV U.S Sales Data & Charts
US Annual Sales
| Year | Sales Units |
|---|---|
| 2011 | 6,444 |
| 2012 | 10,986 |
| 2013 | 13,177 |
| 2014 | 14,890 |
| 2015 | 16,958 |
| 2016 | 17,873 |
| 2017 | 17,858 |
| 2018 | 16,902 |
| 2019 | 20,022 |
| 2020 | 15,248 |
| 2021 | 11,374 |
| 2022 | 12 |
US Annual Growth
Nissan NV Canada Sales Data & Charts
Canada Annual Sales
| Year | Sales Units |
|---|---|
| 2012 | 1,091 |
| 2013 | 1,164 |
| 2014 | 683 |
| 2015 | 760 |
| 2016 | 515 |
| 2017 | 752 |
| 2018 | 827 |
| 2019 | 807 |
| 2020 | 552 |
| 2021 | 309 |


