
Mazda CX-5
This is where you will find monthly and yearly Canadian, European, Chinese and U.S. sales figures for the Mazda CX-5. The Mazda CX-5 is a compact crossover SUV that was first introduced in 2012. It is one of the most popular Mazda models in the US. The CX-5 is available with two engine options: a 2.5L Skyactiv-G four-cylinder engine that produces 187 horsepower and 186 lb-ft of torque, and a turbocharged 2.5L Skyactiv-G engine that produces 250 horsepower and 320 lb-ft of torque. Both engines are paired with an eight-speed automatic transmission. The CX-5 is available in front-wheel drive or all-wheel drive configurations. It has a maximum cargo capacity of 30.9 cubic feet, 59.3 cubic feet with the rear seats folded. The CX-5 comes standard with a long list of features, including an 8.8-inch touchscreen infotainment system, a six-speaker sound system, and a rearview camera. Available features include a 12.3-inch digital instrument cluster, a 10-speaker Bose sound system, and a sunroof.
Mazda CX-5 Overview
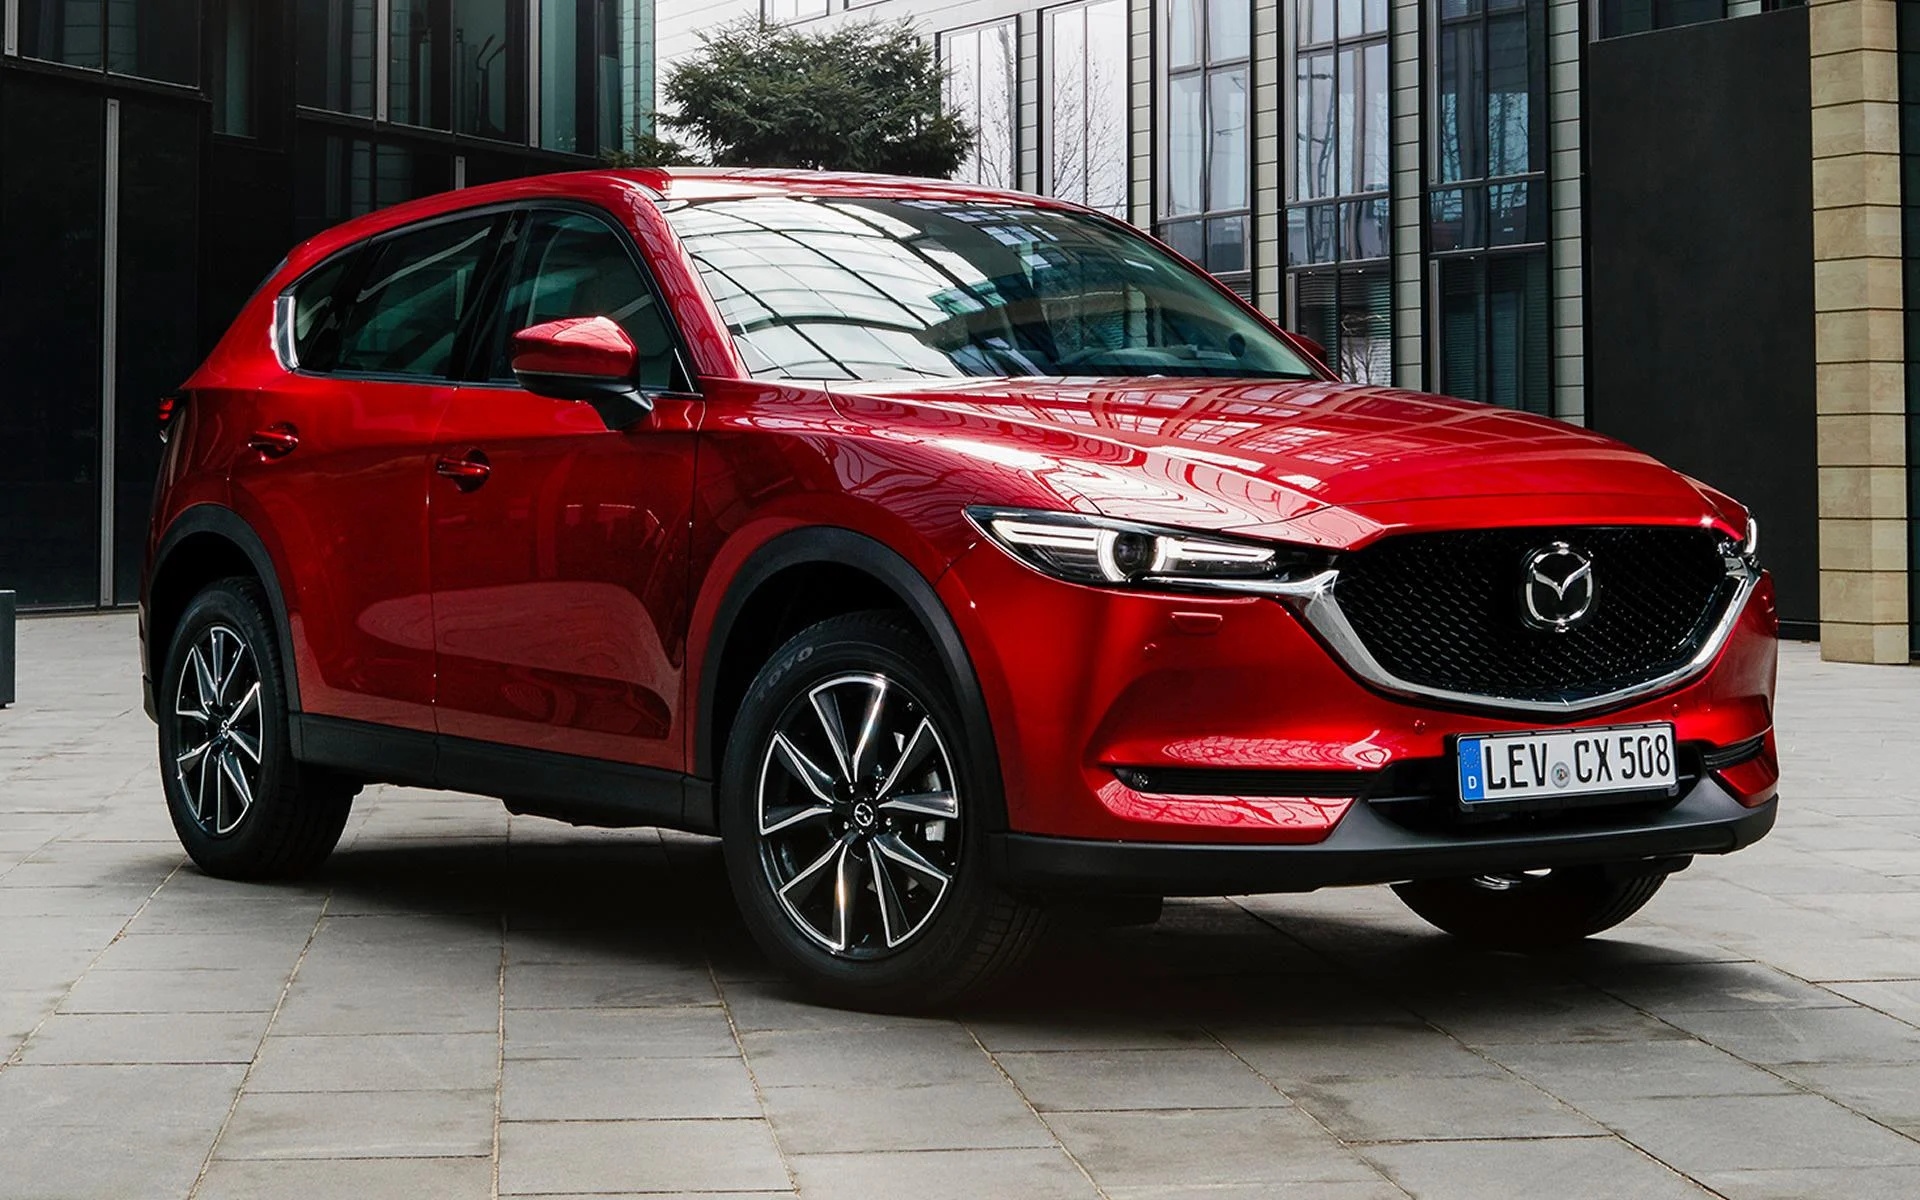
The Mazda CX-5 is a compact crossover SUV and has been a pivotal model in Mazda’s lineup since its introduction. Renowned for its engaging driving dynamics, refined design, and overall value proposition, the CX-5 has cemented its position as one of the top contenders in its segment.
Introduced in 2012, the Mazda CX-5 replaced the Mazda Tribute and was the first vehicle to feature Mazda’s new “Kodo: Soul of Motion” design philosophy. It was also the first to incorporate the full suite of SkyActiv technologies, including chassis, engine, and transmission designs. Since its introduction, the CX-5 has seen multiple updates and is currently in its second generation, which began with the 2017 model year. The “Kodo: Soul of Motion” design language provides the CX-5 with a sleek and modern appearance. This design approach emphasizes flowing lines, a bold front grille, and a dynamic stance. Many automotive critics have noted that the design gives the CX-5 a more premium appearance compared to some competitors in its price range.
Mazda is known for emphasizing driving pleasure, and the CX-5 is no exception. It’s often praised for its precise steering, agile handling, and overall driving experience. Over the years, the CX-5 has been offered with several engine options, including naturally aspirated and turbocharged variants of the SkyActiv-G gasoline engine.
Mazda CX-5 Sales Figures
The CX-5 has consistently received positive reviews and accolades for its blend of design, performance, and interior quality. It competes favorably in its segment against rivals like the Honda CR-V, Toyota RAV4, and Ford Escape. Sold worldwide, the CX-5 has been a critical model for Mazda in terms of sales and brand image. Depending on the market, the vehicle’s specifications, engine options, and features might differ slightly.
Mazda CX-5 U.S Sales Data & Charts
US Monthly Sales
US Annual Sales
| Year | Sales Units |
|---|---|
| 2012 | 43,676 |
| 2013 | 79,544 |
| 2014 | 99,122 |
| 2015 | 111,450 |
| 2016 | 112,235 |
| 2017 | 127,563 |
| 2018 | 150,622 |
| 2019 | 154,543 |
| 2020 | 146,420 |
| 2021 | 163,940 |
| 2022 | 151,594 |
| 2023 | 153,808 |
| 2024 | 34,345 |
US Annual Growth
Mazda CX-5 Canada Sales Data & Charts
Canada Annual Sales
| Year | Sales Units |
|---|---|
| 2011 | 1,315 |
| 2012 | 11,301 |
| 2013 | 17,648 |
| 2014 | 19,920 |
| 2015 | 22,281 |
| 2016 | 25,123 |
| 2017 | 25,404 |
| 2018 | 26,587 |
| 2019 | 27,696 |
| 2020 | 30,583 |
| 2021 | 26,571 |
| 2022 | 11,077 |
Canada Annual Growth
Mazda CX-5 Europe Sales Data & Charts
Europe Annual Sales
| Year | Sales Units |
|---|---|
| 2011 | 14 |
| 2012 | 25,664 |
| 2013 | 49,883 |
| 2014 | 57,289 |
| 2015 | 56,179 |
| 2016 | 55,345 |
| 2017 | 59,499 |
| 2018 | 69,956 |
| 2019 | 64,860 |
| 2020 | 31,703 |
| 2021 | 28,889 |
| 2022 | 31,341 |
Europe Annual Growth
Mazda CX-5 China Sales Data & Charts
China Annual Sales
| Year | Sales Units |
|---|---|
| 2013 | 22,549 |
| 2014 | 51,585 |
| 2015 | 45,110 |
| 2016 | 49,147 |
| 2017 | 49,555 |
| 2018 | 44,256 |
| 2019 | 33,579 |
| 2020 | 33,317 |
| 2021 | 25,363 |
| 2022 | 17,358 |


