
Mazda CX-3
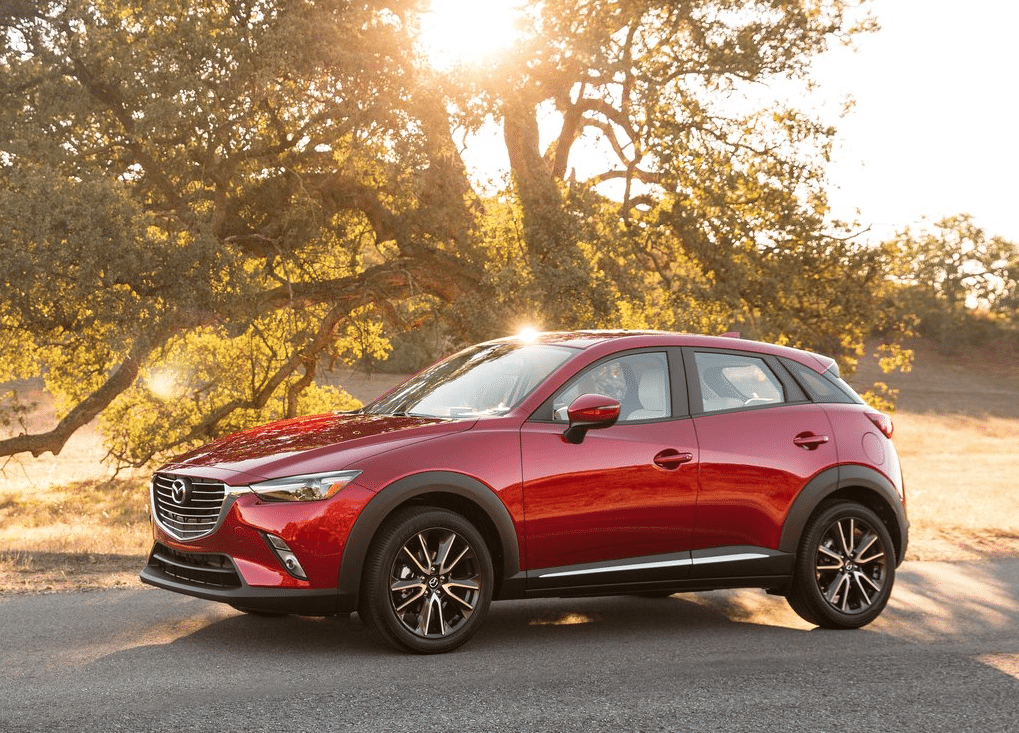
Here you will find monthly and yearly Canadian, European and U.S. sales figures for the Mazda CX-3. The Mazda CX-3 is a subcompact crossover SUV that has been part of Mazda’s lineup since its introduction for the 2016 model year. It’s designed to offer the elevated driving position and versatility of an SUV in a smaller, more urban-friendly package.
Mazda CX-3 Overview
The Mazda CX-3 is a subcompact crossover SUV that was first released in 2015. It is known for its stylish design, fun-to-drive handling, and fuel efficiency. The CX-3 is powered by a 2.0L four-cylinder engine that produces 148 horsepower and 135 lb-ft of torque. It is mated to a six-speed automatic transmission. The CX-3 is available in front-wheel drive or all-wheel drive. It has a fuel economy of up to 29 mpg in the city and 35 mpg on the highway. The CX-3 is relatively spacious for a subcompact crossover SUV, with seating for up to five passengers. It has a cargo capacity of 17.9 cubic feet behind the rear seats and 44.3 cubic feet with the rear seats folded down. The CX-3 is a good car for those looking for a stylish, fun-to-drive, and fuel-efficient subcompact crossover SUV. It is not as spacious as some competitors, but it is more affordable.
Mazda CX-3 Overview Sales Figures
The Mazda CX-3 is a stylish and enjoyable option in the crowded subcompact SUV market. It stands out for its driving dynamics, quality interior, and attractive design. It may be a good choice for those seeking the advantages of an SUV in a more compact and efficient package, particularly if driving pleasure is a priority.
Mazda CX-3 US Sales Data & Charts
US Monthly Sales
US Annual Sales
| Year | Sales Units |
|---|---|
| 2015 | 6,406 |
| 2016 | 18,557 |
| 2017 | 16,355 |
| 2018 | 16,899 |
| 2019 | 16,229 |
| 2020 | 8,335 |
| 2021 | 6,374 |
US Annual Growth
Mazda CX-3 Canada Sales Data & Charts
Canada Annual Sales
| Year | Sales Units |
|---|---|
| 2011 | 122 |
| 2015 | 6,861 |
| 2016 | 9,354 |
| 2017 | 10,938 |
| 2018 | 12,445 |
| 2019 | 10,850 |
| 2020 | 6,445 |
| 2021 | 5,314 |
| 2022 | 2,828 |
Canada Annual Growth
Mazda CX-3 Europe Sales Data & Charts
Europe Annual Sales
| Year | Sales Units |
|---|---|
| 2000 | 3,605 |
| 2015 | 24,232 |
| 2016 | 52,409 |
| 2017 | 53,871 |
| 2018 | 55,548 |
| 2019 | 61,962 |
| 2020 | 5,171 |
| 2021 | 13,879 |
| 2022 | 3,609 |


