
Maserati Levante
Here you will find monthly and yearly Canadian, European and U.S. sales figures for the Maserati Levante. The Maserati Levante is a luxury SUV that was first introduced in 2016. It is the first SUV to be produced by Maserati since the Kubang concept car.
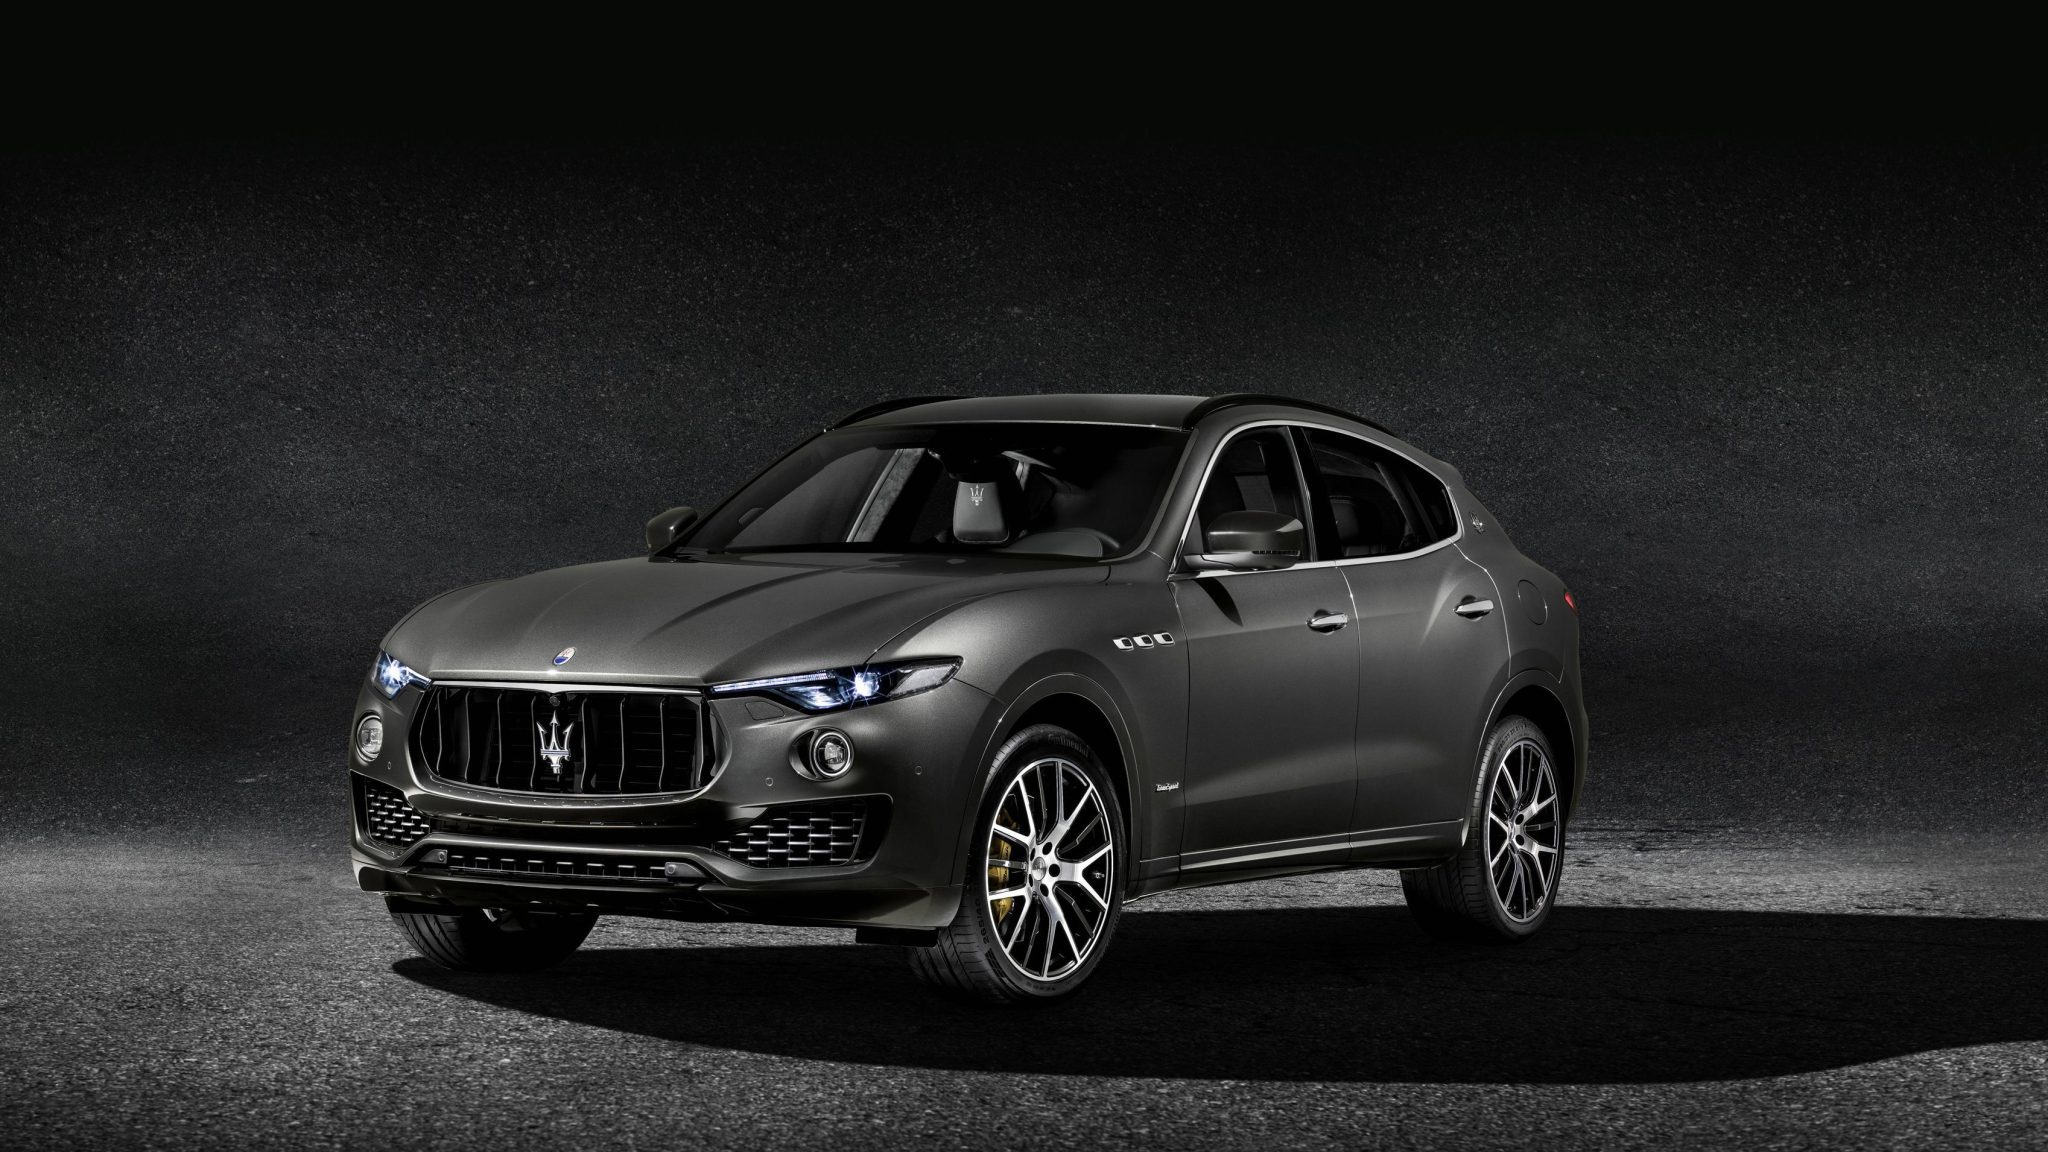
Maserati Levante Overview
The Levante is available with a choice of two engines: a 3.0-liter twin-turbocharged V6 engine that produces 350 horsepower and 369 lb-ft of torque, or a 3.8-liter twin-turbocharged V8 engine that produces 550 horsepower and 538 lb-ft of torque. Both engines are mated to an eight-speed automatic transmission. The Levante is available in rear-wheel drive or all-wheel drive configurations. It has a top speed of 177 mph and can accelerate from 0 to 60 mph in 5.2 seconds.
The Levante is known for its luxurious interior, which is made with high-quality materials and features a variety of amenities, such as a 10.1-inch touchscreen infotainment system, a 12-speaker Harman Kardon sound system, and a panoramic sunroof. The Levante is a good choice for buyers who are looking for a luxurious and stylish SUV. It is not as popular as some rivals, such as the Porsche Cayenne and the BMW X5, but it is a good value for money car.
The Maserati Levante has been praised for its stylish design, powerful engines, and luxurious interior. However, it has also been criticized for its relatively high price tag and its lack of fuel efficiency. The Maserati Levante is a good choice for buyers who are looking for a luxurious and stylish SUV that is not as common as some rivals. It is a good value for money car, but it is not as fuel-efficient as some rivals.
The Levante is available in four trim levels: GranLusso, GranSport, Modena, and Trofeo. The GranLusso is the base trim level and comes standard with features such as 19-inch wheels, a leather-wrapped steering wheel, and a panoramic sunroof. The GranSport adds features such as 20-inch wheels, a sport-tuned suspension, and a Brembo brake system. The Modena is the mid-level trim level and comes standard with features such as a 3.0-liter V6 engine, a limited-slip differential, and a heated steering wheel. The Trofeo is the top-of-the-line trim level and comes standard with features such as a 3.8-liter V8 engine, a carbon fiber body kit, and an adaptive suspension.
In 2023, Maserati will introduce a hybrid version of the Levante called the Levante Hybrid. The Levante Hybrid will be powered by a 2.0-liter turbocharged four-cylinder engine and an electric motor that together produce 330 horsepower and 332 lb-ft of torque. The Levante Hybrid will also be available with all-wheel drive.
Maserati Levante U.S Sales Data & Charts
US Monthly Sales
US Annual Sales
| Year | Sales Units |
|---|---|
| 2016 | 1,917 |
| 2017 | 5,483 |
| 2018 | 1,475 |
US Annual Growth
Maserati Levante Canada Sales Data & Charts
Canada Annual Sales
| Year | Sales Units |
|---|---|
| 2016 | 187 |
| 2017 | 669 |
| 2018 | 389 |
| 2019 | 342 |
| 2020 | 227 |
| 2021 | 449 |


