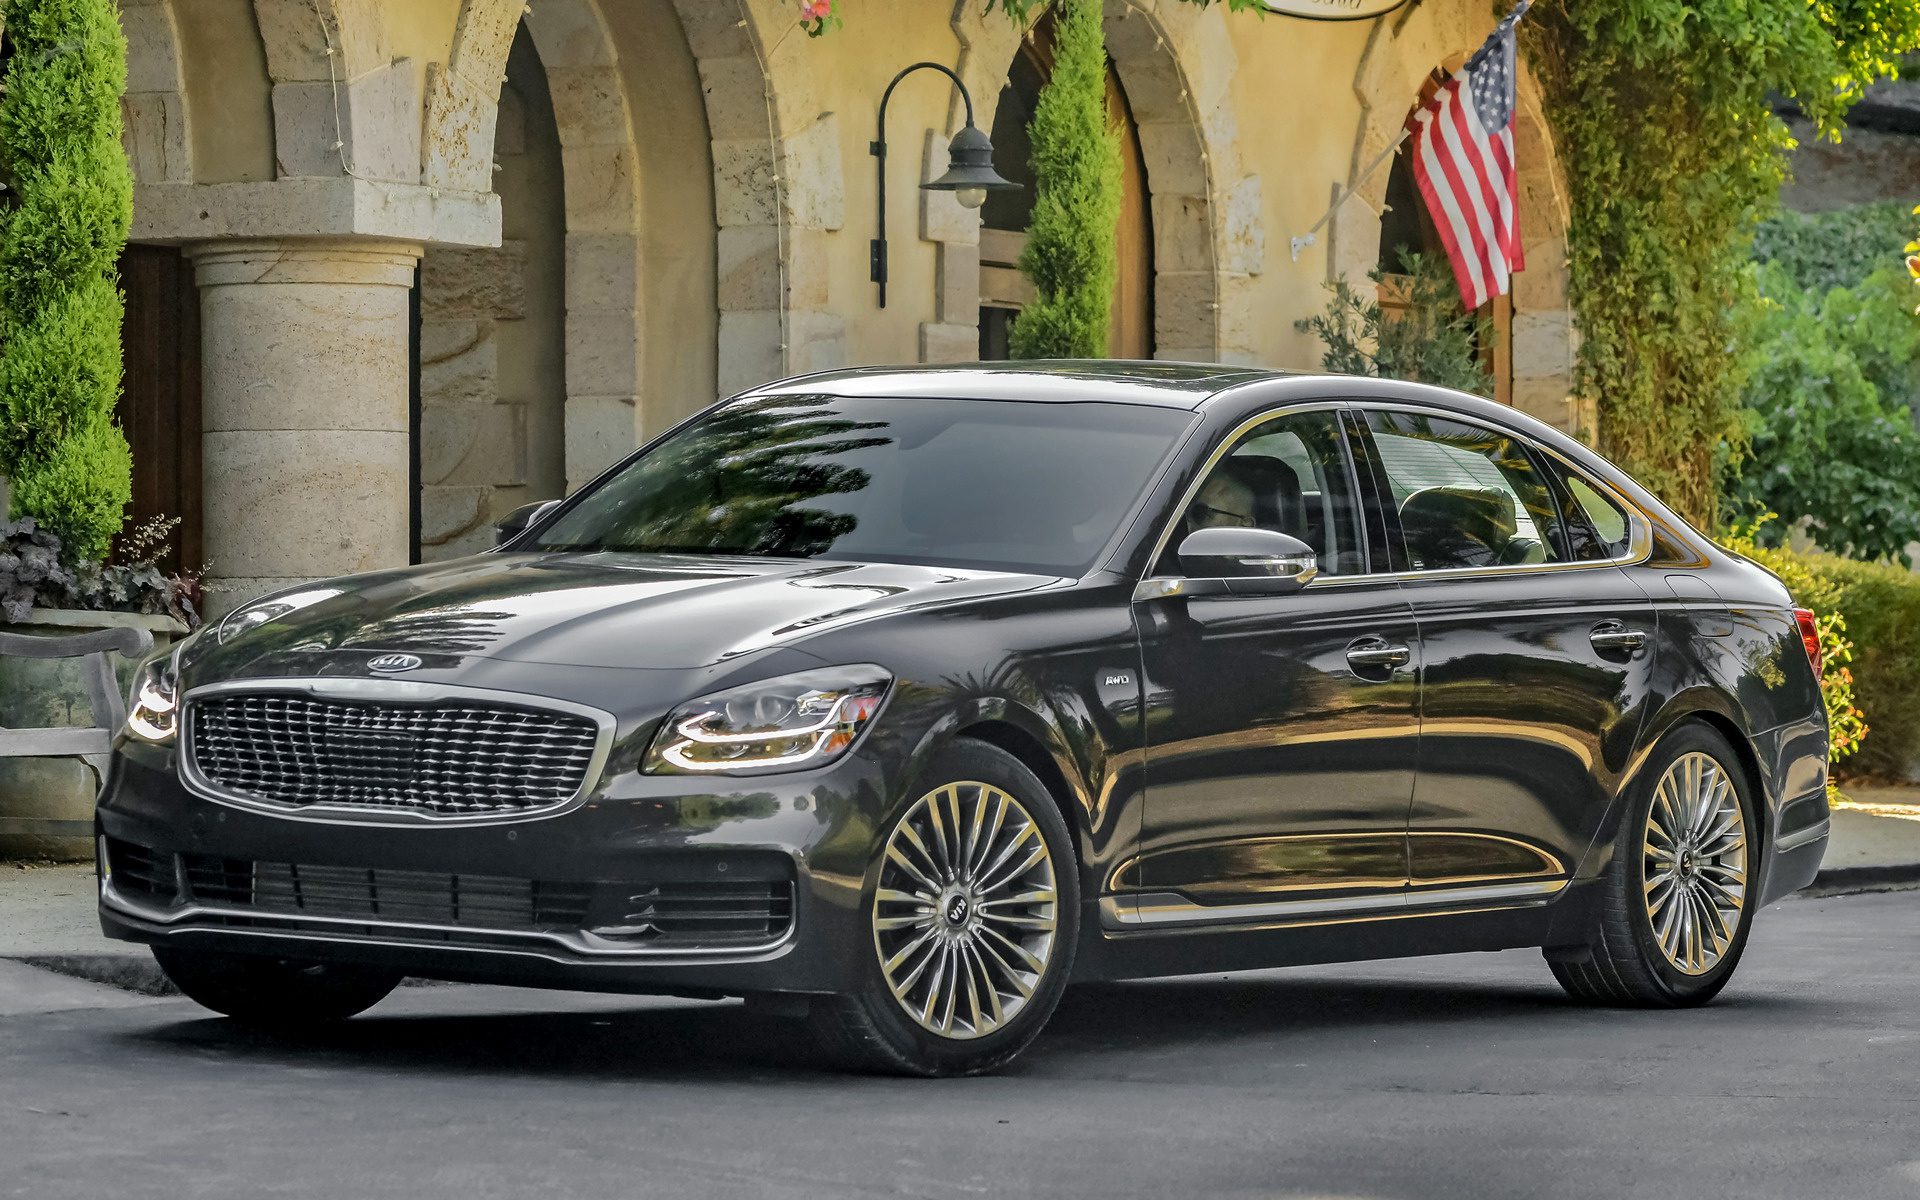
The Kia K900 is a full-size luxury sedan that was first introduced in 2014. It is available in rear-wheel drive and all-wheel drive configurations. It is powered by a 3.8L V6 engine that produces 365 horsepower and 293 lb-ft of torque. It is mated to an 8-speed automatic transmission. The K900 is known for its luxurious interior, powerful engine, and long list of standard features. It is a popular choice for people who are looking for a high-end sedan that is both comfortable and stylish. Overall, the Kia K900 is a good choice for people who are looking for a luxurious and powerful full-size sedan. It is not as well-known as some other luxury brands, but it still offers a lot of value for the price. The Kia K900 was redesigned in 2020 and received a number of updates, including a new exterior design, a revised interior, and a more powerful engine. The 2023 Kia K900 starts at $47,190.