
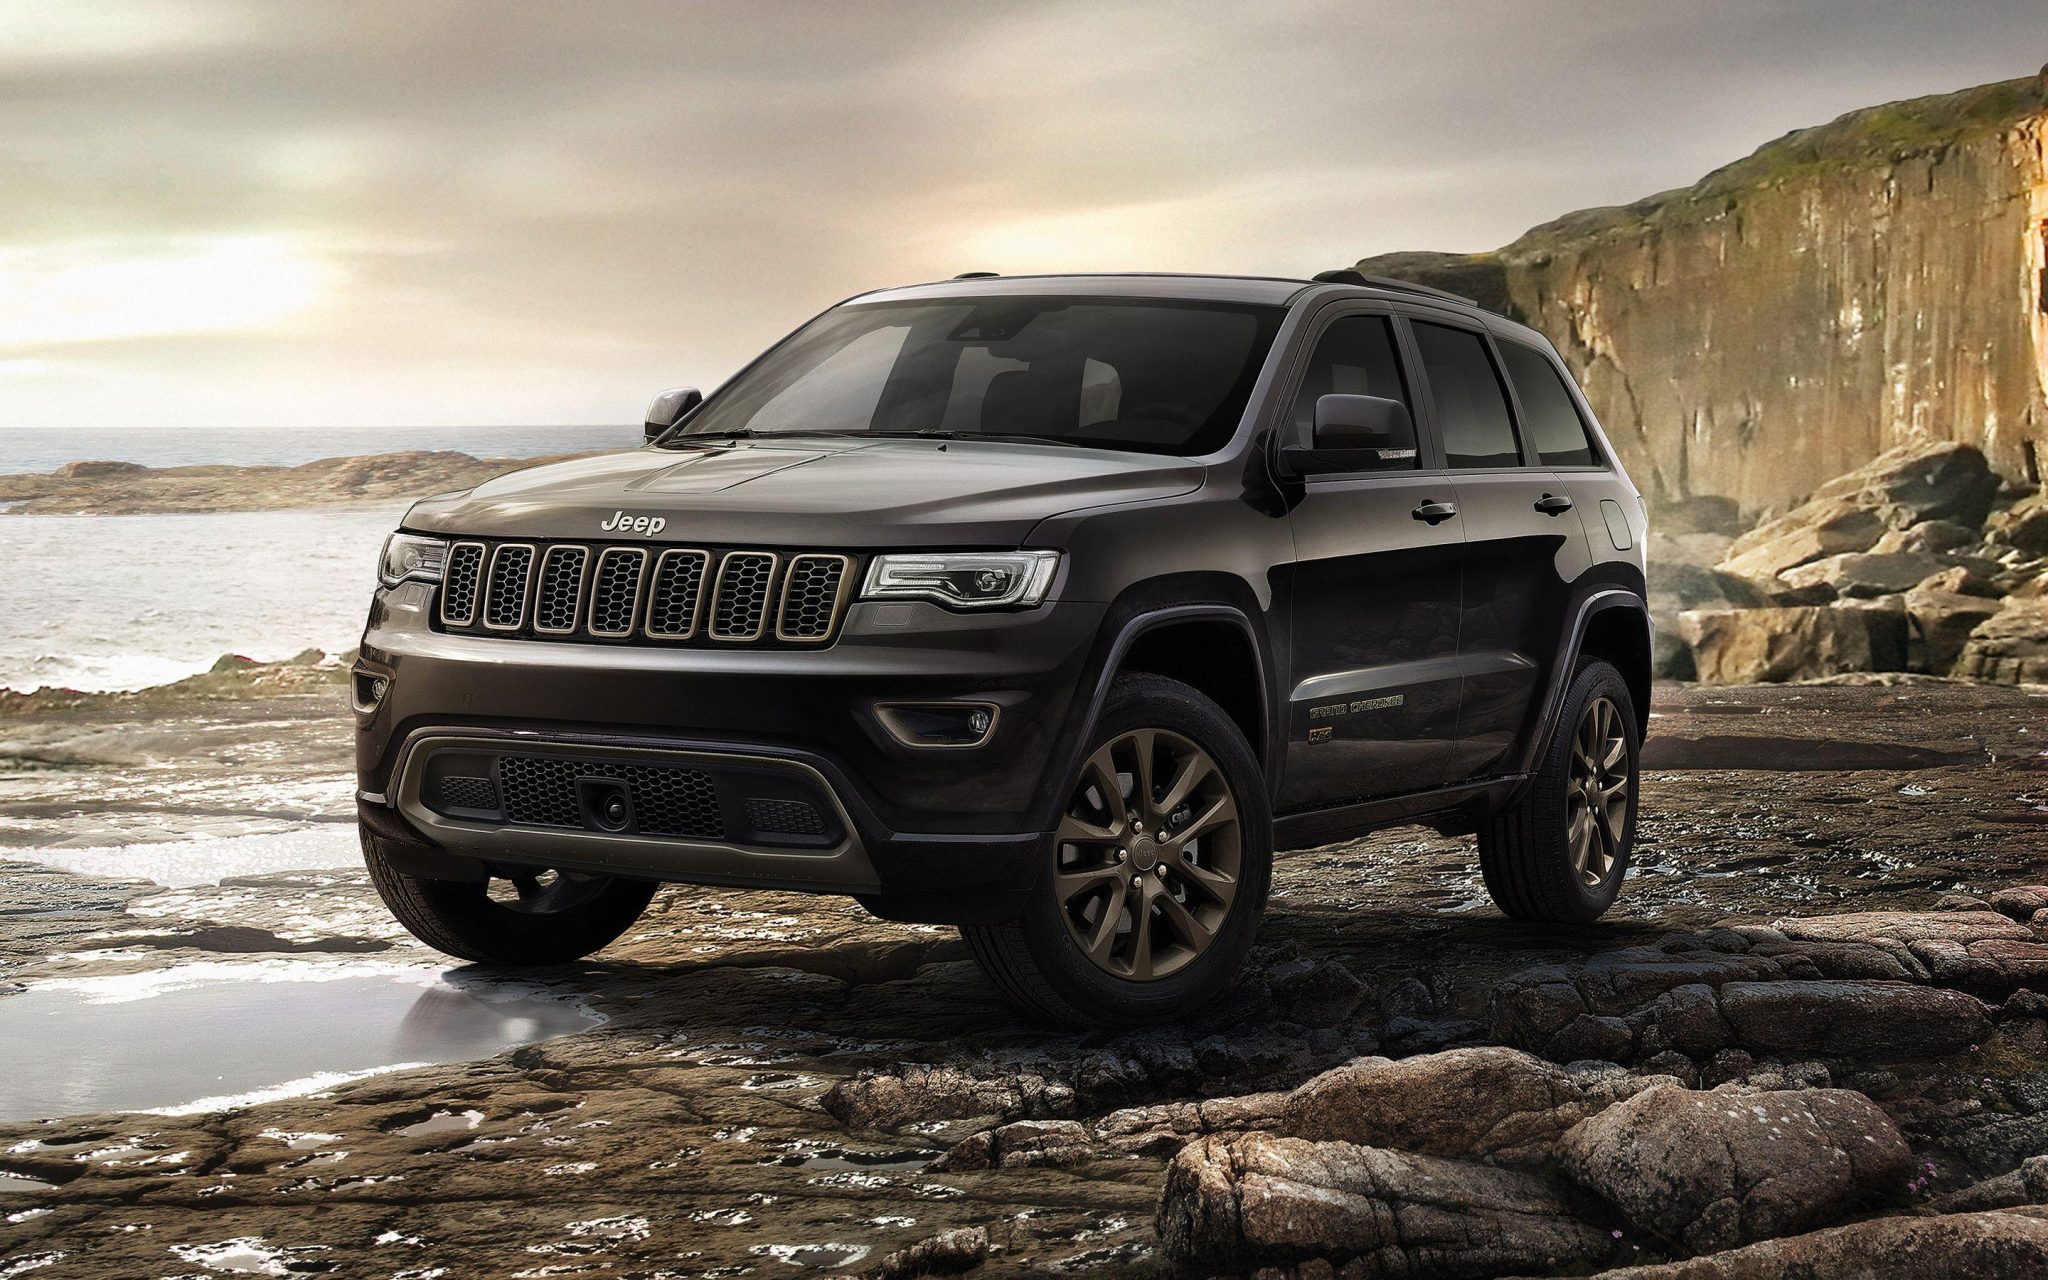
Jeep Grand Cherokee
Here you will find monthly and yearly Canadian, European and U.S. sales figures for the Jeep Grand Cherokee. The Jeep Grand Cherokee is a mid-size SUV that has been in production since 1992. Produced by Jeep, a division of Stellantis (formerly Fiat Chrysler Automobiles), the Grand Cherokee has been one of the brand’s flagship models and is known for combining off-road capability with comfort and luxury features.
Jeep Grand Cherokee Overview
The Jeep Grand Cherokee was introduced in 1992 as a 1993 model, marking Jeep’s foray into the luxury SUV segment. While staying true to Jeep’s rugged off-road heritage, the Grand Cherokee aimed to provide more comfort, luxury, and on-road manners compared to its sibling, the Jeep Cherokee. Over the years, the Grand Cherokee has been offered with a variety of engines, from fuel-efficient V6s to powerful V8s, and even diesel options in some markets. The Grand Cherokee typically offers various 4×4 systems, like Quadra-Trac and Quadra-Drive, as well as an adjustable air suspension in recent models, ensuring it retains Jeep’s off-road prowess.
It is currently in its fifth generation, which was introduced in 2021. The Grand Cherokee is known for its off-road capability, luxurious interior, and wide range of features. The current-generation Grand Cherokee is available with a choice of three engines: a 3.6-liter V6 engine, a 5.7-liter V8 engine, and a 3.0-liter turbocharged diesel engine. All three engines are mated to an eight-speed automatic transmission. The Grand Cherokee is available in a variety of trim levels, including the base Laredo, the mid-level Limited, and the top-of-the-line Summit. The Grand Cherokee is a popular car in the United States. It has won numerous awards, including the 2021 Motor Trend SUV of the Year award.
Jeep Grand Cherokee Sales Figures
The Grand Cherokee has consistently been one of Jeep’s best-selling models, popular for its blend of off-road capability, luxury, and value. While the Grand Cherokee has been generally well-received, it hasn’t been without criticisms, especially in earlier models, which faced concerns over build quality and reliability. The Jeep Grand Cherokee stands as a testament to the brand’s ability to evolve while staying true to its roots. It strikes a balance between rugged utility and luxury, offering a compelling option for those looking for a versatile SUV. Over the decades, the Grand Cherokee has grown in sophistication and capability, solidifying its place as a key player in the mid-size SUV segment.
Jeep Grand Cherokee U.S Sales Data & Charts
US Monthly Sales
US Annual Sales
| Year | Sales Units |
|---|---|
| 2005 | 213,584 |
| 2006 | 139,148 |
| 2007 | 120,937 |
| 2008 | 73,678 |
| 2009 | 50,328 |
| 2010 | 84,635 |
| 2011 | 127,744 |
| 2012 | 167,458 |
| 2013 | 174,275 |
| 2014 | 183,786 |
| 2015 | 195,958 |
| 2016 | 212,704 |
| 2017 | 240,696 |
| 2018 | 224,908 |
| 2019 | 242,969 |
| 2020 | 209,786 |
| 2021 | 254,445 |
| 2022 | 223,344 |
| 2023 | 244,597 |
| 2024 | 54,455 |
US Annual Growth
Jeep Grand Cherokee Canada Sales Data & Charts
Canada Annual Sales
| Year | Sales Units |
|---|---|
| 2012 | 10,416 |
| 2013 | 11,587 |
| 2014 | 13,150 |
| 2015 | 11,605 |
| 2016 | 14,912 |
| 2017 | 16,877 |
| 2018 | 14,099 |
| 2019 | 18,659 |
| 2020 | 16,967 |
| 2021 | 17,997 |
Canada Annual Growth
Jeep Grand Cherokee Europe Sales Data & Charts
Europe Annual Sales
| Year | Sales Units |
|---|---|
| 1997 | 17,991 |
| 1998 | 16,532 |
| 1999 | 26,028 |
| 2000 | 24,731 |
| 2001 | 18,865 |
| 2002 | 23,836 |
| 2003 | 20,681 |
| 2004 | 18,684 |
| 2005 | 16,855 |
| 2006 | 20,597 |
| 2007 | 15,934 |
| 2008 | 8,384 |
| 2009 | 4,215 |
| 2010 | 3,785 |
| 2011 | 6,161 |
| 2012 | 10,383 |
| 2013 | 11,155 |
| 2014 | 13,820 |
| 2015 | 13,719 |
| 2016 | 13,191 |
| 2017 | 10,167 |
| 2018 | 7,963 |
| 2019 | 7,129 |
| 2020 | 4,636 |
| 2021 | 534 |
| 2022 | 189 |
Europe Annual Growth
Jeep Grand Cherokee Generations
First Generation (ZJ, 1993-1998)
The first generation Grand Cherokee was introduced in 1993 and was based on the Mercedes-Benz M-Class platform. It was available with a choice of two engines: a 4.0-liter V6 engine and a 5.2-liter V8 engine. Both engines were mated to a four-speed automatic transmission. The original model, with a unibody construction, was somewhat more upscale than the Cherokee.
Second Generation (WJ, 1999-2004)
The second generation Grand Cherokee was introduced in 1999 and was redesigned with a more modern look. It was also available with a choice of two engines: a 4.0-liter V6 engine and a 5.7-liter V8 engine. Both engines were mated to a five-speed automatic transmission. This generation offered improved performance, a refined design, and more luxury features. The V8 models, particularly those with the 4.7L PowerTech engine, were notable for their power.
Third Generation (WK, 2005-2010)
The third generation Grand Cherokee was introduced in 2005 and was redesigned with a more luxurious interior. It was also available with a choice of three engines: a 3.7-liter V6 engine, a 4.7-liter V8 engine, and a 5.7-liter V8 engine. All three engines were mated to a five-speed automatic transmission. Built on a new platform, this iteration offered even more sophisticated technology and luxury features, as well as a notable SRT-8 performance version powered by a 6.1L Hemi V8.
Fourth Generation (WK2, 2011-2020)
The fourth generation Grand Cherokee was introduced in 2011 and was redesigned with a more aggressive look. It was also available with a choice of three engines: a 3.6-liter V6 engine, a 5.7-liter V8 engine, and a 3.0-liter turbocharged diesel engine. All three engines were mated to an eight-speed automatic transmission. With a comprehensive redesign, this generation brought advanced technological features, enhanced off-road capabilities, and a wider range of powertrain options. The high-performance SRT version and the supercharged Trackhawk variant garnered significant attention.
Fifth Generation (WL, 2021-Present)
The fifth generation Grand Cherokee was introduced in 2021 and is the current generation. It is available with a choice of three engines: a 3.6-liter V6 engine, a 5.7-liter V8 engine, and a 4xe plug-in hybrid powertrain. All three engines are mated to an eight-speed automatic transmission. The current generation presents a more refined and modern design, expanded tech features, and the introduction of a three-row variant known as the Grand Cherokee L.


