
Jaguar Sales Data, Trends, Analysis & Current Lineup for the U.S Automotive Market
This is your hub for all of the Jaguar sales data for the U.S market. Jaguar is a British luxury vehicle brand currently owned by Jaguar Land Rover. The brand is known for its luxury sedans, SUVs, and sports cars such as the Jaguar XF, Jaguar I-Pace, and Jaguar F-Type.
The company has been making luxurious sedans and highly competitive sports cars for decades. But just recently, the brand has also expanded their product offerings. They’ve added a crossover and a SUV to their portfolio which continues to perpetuate the brand’s main attributes fast speed, powerful acceleration, responsive handling, and incredible aesthetics.
Whether it’s a sedan, a crossover, or SUV, a Jaguar is a blast to drive. Even their entry-level luxury models such as , the XE and the subcompact E-Pace, are a joy to drive. The XE caters to mainstream customers which will allow them to join in the company’s exclusive club.
Jaguar U.S Sales Figures & Recent Highlights
In 2016, Jaguar has been reported as being the hottest brand in the the United States. This is due to the surge of their sales which rose from 14,496 in 2015 to 31,243 by next year. By 2017, the brand followed up their success from 2016 and hit their highest reported sales in a calendar year, 39,886 vehicles.
The year 2017 was the most successful year for Jaguar so far in the US. Their newly introduced electric SUVs such as the Jaguar E-Pace, Jaguar F-Pace, and Jaguar I-Pace are incredibly popular in the country. Even though sales of Jaguar-branded vehicles in 2018 and 2019 were down as compared to 2017, we expect the British luxury marquee to find more success in the US market as more and more customers are switching to electric vehicles.
In the United States, Jaguar sales have been declining in recent years. In 2021, Jaguar sales in the United States decreased by 15% to 17,000 vehicles. This was the third consecutive year of declining sales for Jaguar in the United States. There are a number of factors that have contributed to the decline in Jaguar sales in the United States. One factor is the increasing popularity of luxury SUVs. Jaguar does not offer a full lineup of SUVs, and its SUVs are not as popular as those of its competitors.
Jaguar Monthly Sales Data in the U.S
Below we have a table that shows Jaguar sales for the United States automotive market, but this time it is broken out by month. This is on a unit basis. This is Jaguar new vehicle sales in the US.
Jaguar Annual Sales, Growth & Market Share in the United States
Below we have a table that shows total Jaguar sales volumes for the US automotive market, broken out by year. This data captures all Jaguar vehicle sales for the entire United States automotive market.
| Year | Sales | YOY Change | US Marketshare | Marketshare Change |
|---|---|---|---|---|
| 2005 | 30,424 | 0.00 | 0.18 | 0.00 |
| 2006 | 20,683 | -32.02 | 0.12 | -43.23 |
| 2007 | 15,683 | -24.17 | 0.10 | -28.37 |
| 2008 | 10,625 | -32.25 | 0.08 | -21.30 |
| 2009 | 10,380 | -2.31 | 0.10 | 19.32 |
| 2010 | 13,340 | 28.52 | 0.11 | 13.21 |
| 2011 | 12,695 | -4.84 | 0.10 | -15.84 |
| 2012 | 13,033 | 2.66 | 0.08 | -17.69 |
| 2013 | 16,952 | 30.07 | 0.11 | 22.83 |
| 2014 | 15,773 | -6.95 | 0.10 | -13.40 |
| 2015 | 14,496 | -8.10 | 0.08 | -15.16 |
| 2016 | 31,243 | 115.53 | 0.18 | 53.35 |
| 2017 | 39,886 | 27.66 | 0.23 | 23.08 |
| 2018 | 30,254 | -24.15 | 0.17 | -32.59 |
| 2019 | 31,005 | 2.48 | 0.18 | 4.25 |
| 2020 | 21,786 | -29.73 | 0.15 | -22.77 |
| 2021 | 17,149 | -21.28 | 0.11 | -29.14 |
| 2022 | 9,668 | -43.62 | 0.07 | -62.36 |
| 2023 | 8,348 | -13.65 | 0.05 | -31.45 |
| 2024 | 3,073 | 0.00 | 0.08 | 0.00 |
Jaguar U.S Annual Sales Units & Growth Chart
Below is a visual representation of Jaguar’s U.S sales units over time. We have both the Jaguar sales units and the growth in the United States market. Click on the items in the legend to see each series by itself.
Jaguar U.S Growth Rate & Market Share Chart
Below is the annual growth rate for the Jaguar brand in the United States, shown against the Jaguar’s marketshare changes in the United States. This gives you a good look into how Jaguar has faired against the other brands in terms of absolute sales and effect on marketshare. Click on the items in the legend to see each series by itself.
The Best-Selling Jaguar Cars & SUVs in the United States
- Jaguar F-Pace (5,979 sold in 2022).The current Jaguar F-Pace is a mid-size luxury SUV that was first introduced in 2016. It is known for its stylish design, powerful engines, and agile handling. Overall, the Jaguar F-Pace is a good choice for those who are looking for a stylish and luxurious SUV with a powerful engine and agile handling. However, it is important to consider the steep price tag and small cargo space before making a decision.
- Jaguar F-Type (1,366 sold in 2022).The current Jaguar F-Type is a sports car that was first introduced in 2013. It is known for its sleek design, powerful engines, and exhilarating driving experience. The F-Type is a good choice for those who are looking for a stylish and luxurious sports car with a powerful engine and exhilarating driving experience. It is also a good choice for those who want a sports car that can handle light track driving.
- Jaguar E-Pace (1,059 sold in 2022).The Jaguar E-Pace is a subcompact luxury SUV that was first introduced in 2017. It is known for its stylish design, agile handling, and available all-electric powertrain. The E-Pace is a good choice for those who are looking for a stylish and luxurious subcompact SUV with a powerful engine and agile handling. It is also a good choice for those who want an SUV that can handle light off-road driving.
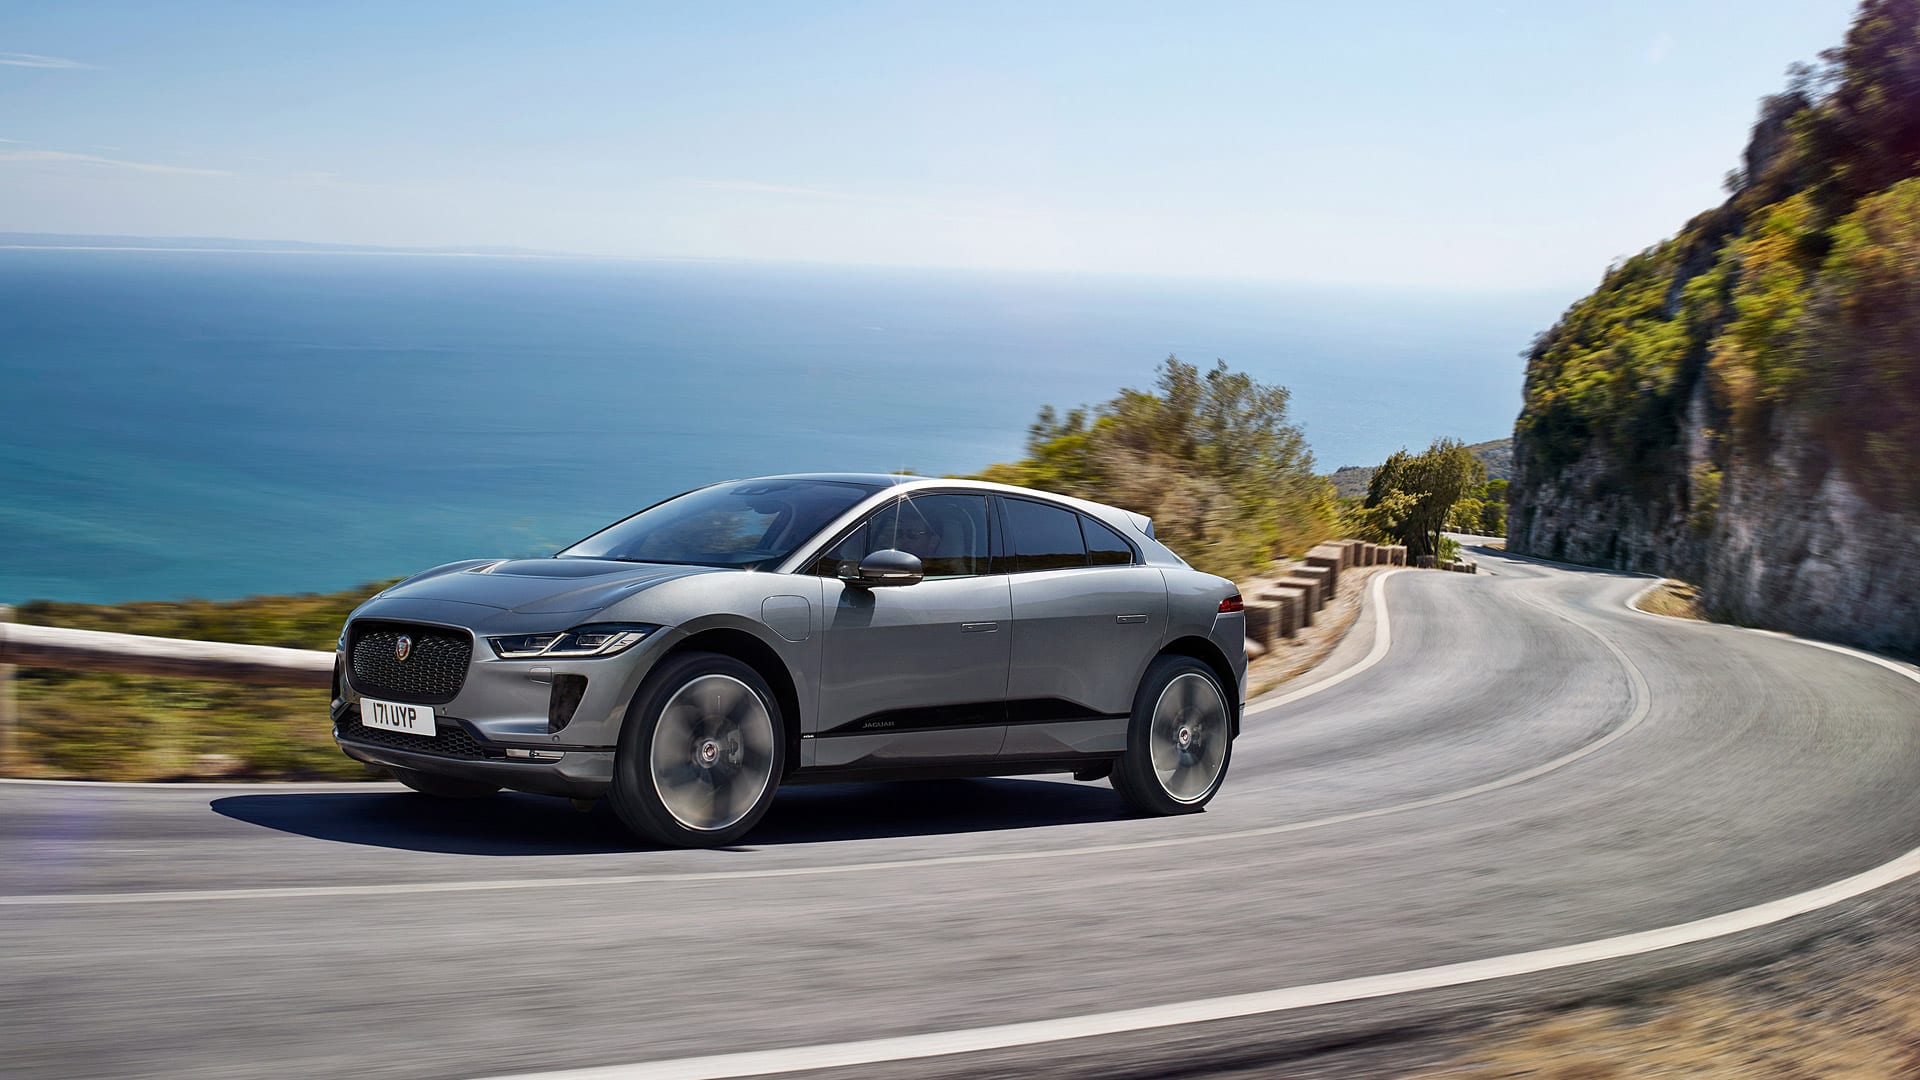
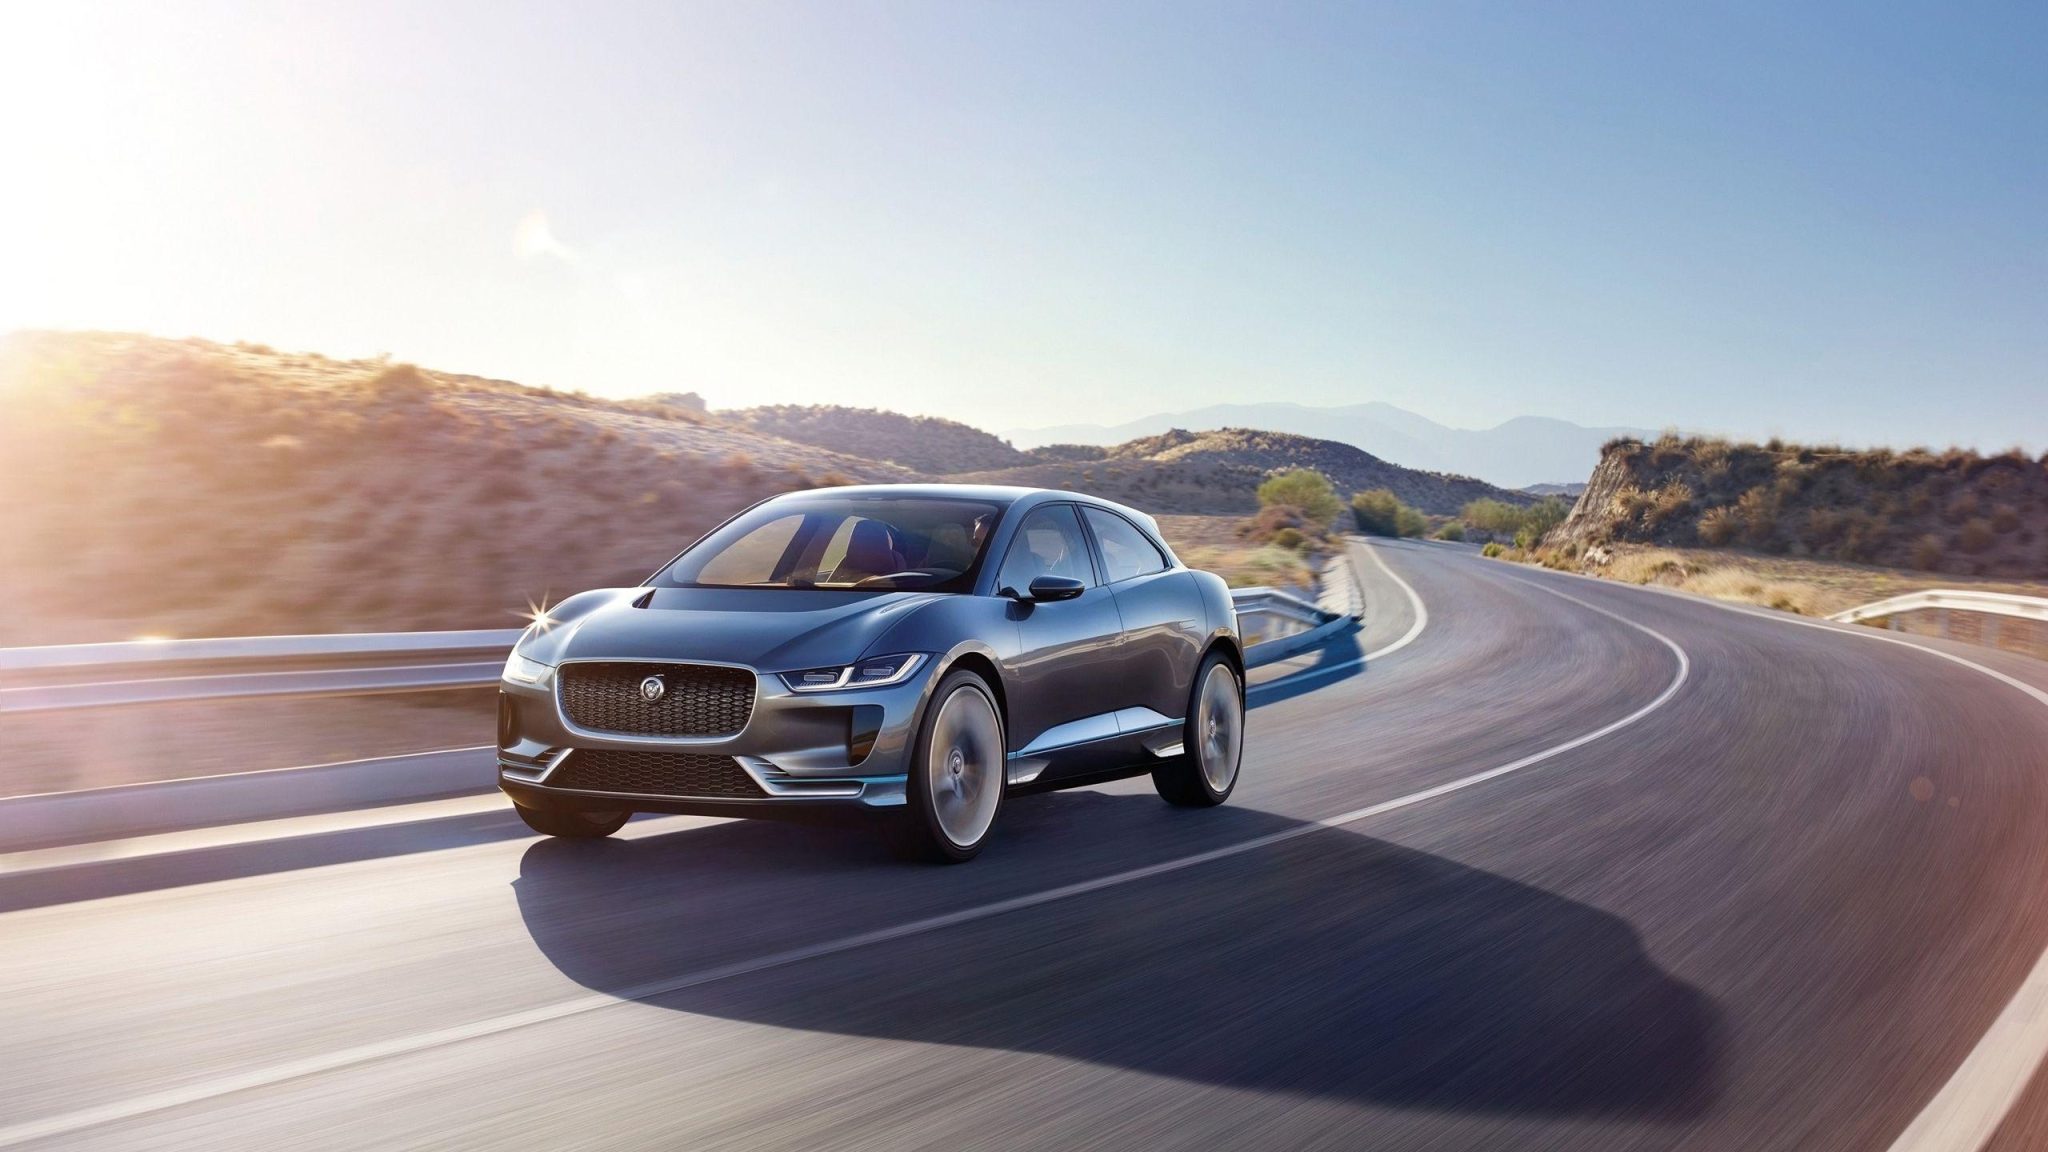
- Jaguar I-Pace (439 sold in 2022). The Jaguar I-Pace is a battery-electric SUV that was first introduced in 2018. It is known for its stylish design, powerful electric motors, and long driving range. The Jaguar I-Pace is a good choice for those who are looking for a stylish and luxurious electric SUV with a powerful electric motor and long driving range. It is also a good choice for those who want an SUV that can handle light off-road driving.
- Jaguar XF (809 sold in 2022).The current Jaguar XF is a midsize luxury sedan that was first introduced in 2015. It is known for its stylish design, powerful engines, and comfortable ride. No major changes are expected for the 2024 Jaguar XF. The Jaguar XF is a good choice for those who are looking for a stylish and luxurious midsize sedan with a powerful engine and comfortable ride. It is also a good choice for those who want a sedan that can handle light off-road driving.
The Current Jaguar Model Lineup & Prices in the U.S
In early 2021, Jaguar Land Rover announced its ‘Reimagine’ strategy, aiming for Jaguar to become an all-electric luxury brand by 2025. This strategy would set the stage for the brand’s shift towards sustainability while leveraging its luxury positioning. Jaguar has been investing in electric vehicles (EVs), with the Jaguar I-PACE being the brand’s first all-electric SUV, which has received critical acclaim and awards. Jaguar has always been positioned as a luxury brand, and their strategy consistently revolves around producing high-quality vehicles that emphasize luxury, performance, and design. In line with industry trends, Jaguar expanded its product lineup to include SUVs and crossovers, like the F-PACE and E-PACE, in addition to its traditional sedans and sports cars.

Jaguar F-Pace
Starting at $57,000
The 2023 F-Pace is available with three engine options: a 2.0L turbocharged inline-4, a 3.0L supercharged V6, and a 3.0L turbocharged inline-6. The 2.0L engine produces 247 horsepower and 269 lb-ft of torque, the 3.0L supercharged V6 produces 380 horsepower and 332 lb-ft of torque, and the 3.0L turbocharged inline-6 produces 400 horsepower and 346 lb-ft of torque. All engines are mated to an 8-speed automatic transmission.
The F-Pace is available in rear-wheel drive or all-wheel drive. It gets an EPA-estimated 22 mpg in the city and 29 mpg on the highway in rear-wheel drive, and 20 mpg in the city and 27 mpg on the highway in all-wheel drive.
The F-Pace is available in five trim levels: P250, P340, P400, R-Dynamic S, and R-Dynamic SVR. The P250 is the base trim level, and it comes standard with features like a 10.0-inch touchscreen infotainment system, a 12.3-inch digital instrument cluster, and a panoramic sunroof. The P340 and P400 trims add more features, such as a more powerful engine, a sport-tuned suspension, and upgraded brakes. The R-Dynamic S and R-Dynamic SVR trims are the most luxurious and performance-oriented trims, and they come standard with even more features, such as a more aggressive exterior styling, a performance exhaust system, and 21-inch wheels.
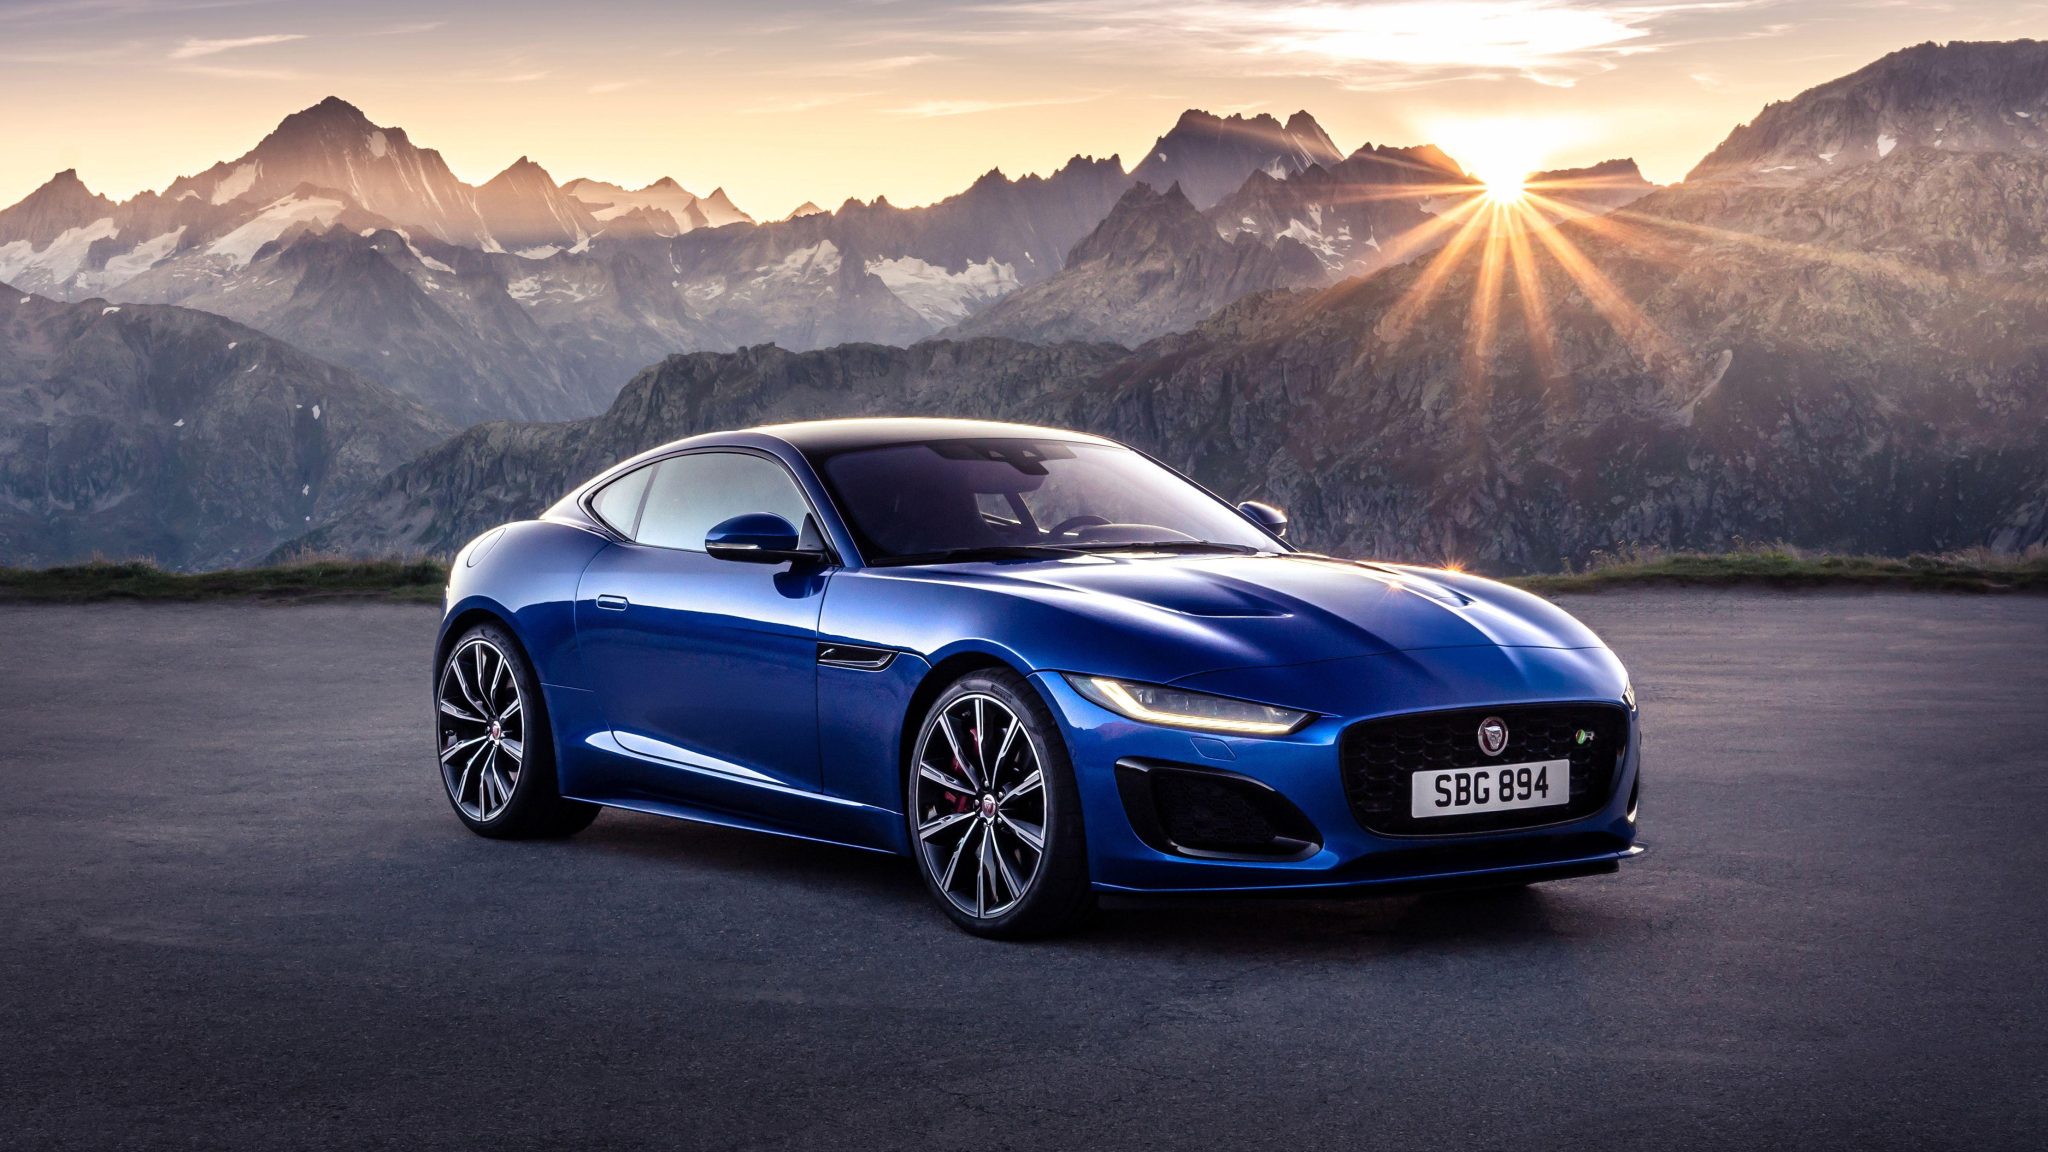
Jaguar F-Type
Starting at $77,900
The 2023 F-Type is available with two engine options: a 2.0L turbocharged inline-4 and a 5.0L supercharged V8. The 2.0L engine produces 296 horsepower and 295 lb-ft of torque, and the 5.0L engine produces 575 horsepower and 516 lb-ft of torque. Both engines are mated to an 8-speed automatic transmission.
The F-Type is available in rear-wheel drive or all-wheel drive. It gets an EPA-estimated 22 mpg in the city and 30 mpg on the highway in rear-wheel drive, and 19 mpg in the city and 26 mpg on the highway in all-wheel drive.
The F-Type is available in four trim levels: P300, P380, P450, and R. The P300 is the base trim level, and it comes standard with features like a 10.0-inch touchscreen infotainment system, a 12.3-inch digital instrument cluster, and a panoramic sunroof. The P380 and P450 trims add more features, such as a more powerful engine, a sport-tuned suspension, and upgraded brakes. The R trim is the most performance-oriented trim, and it comes standard with even more features, such as a more aggressive exterior styling, a performance exhaust system, and 20-inch wheels.
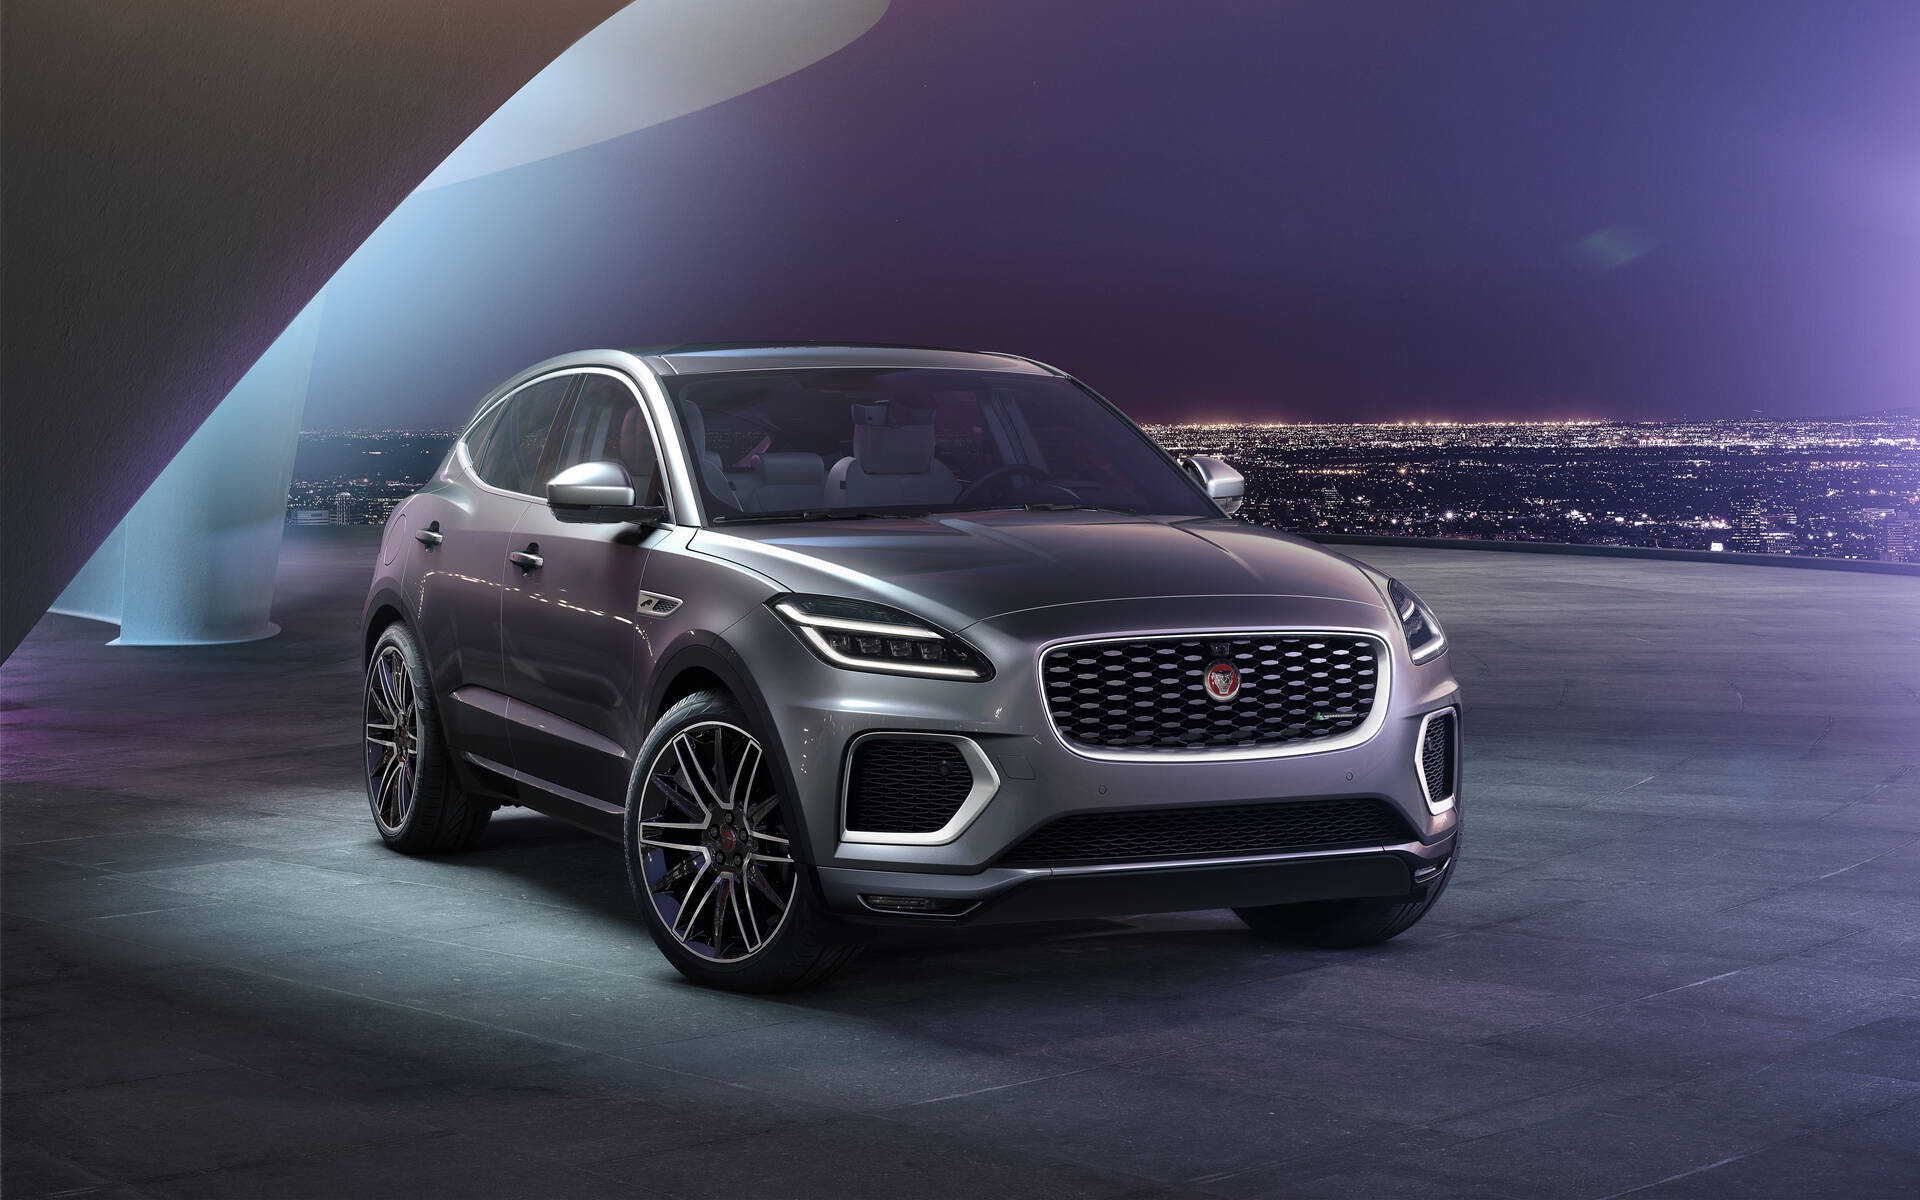
Jaguar E-Pace
Starting at $49,500
The 2023 E-Pace is available with two powertrain options: a 2.0L turbocharged inline-4 and a PHEV (plug-in hybrid electric vehicle) powertrain. The 2.0L engine produces 246 horsepower and 269 lb-ft of torque, and the PHEV powertrain combines a 1.5L turbocharged 3-cylinder engine with an electric motor for a total output of 302 horsepower and 320 lb-ft of torque. Both powertrains are mated to an 8-speed automatic transmission.
The E-Pace is available in rear-wheel drive or all-wheel drive. It gets an EPA-estimated 22 mpg in the city and 30 mpg on the highway in rear-wheel drive, and 20 mpg in the city and 27 mpg on the highway in all-wheel drive. The PHEV powertrain gets an EPA-estimated 34 miles of electric range and 37 mpg combined.
The E-Pace is available in four trim levels: S, SE, R-Dynamic S, and R-Dynamic HSE. The S is the base trim level, and it comes standard with features like a 10.0-inch touchscreen infotainment system, a 12.3-inch digital instrument cluster, and a panoramic sunroof. The SE trim adds more features, such as a heated steering wheel, a power-adjustable driver’s seat, and a hands-free power tailgate. The R-Dynamic S and R-Dynamic HSE trims are the most luxurious and performance-oriented trims, and they come standard with even more features, such as a sport-tuned suspension, upgraded brakes, and 20-inch wheels.
Jaguar I-Pace
Starting at $73,275
The 2023 I-Pace has a 90.0-kWh battery pack that powers two electric motors, one on each axle. The motors produce a combined output of 394 horsepower and 512 lb-ft of torque. The I-Pace can go from 0 to 60 mph in 4.5 seconds and has a top speed of 120 mph. The I-Pace has an EPA-estimated range of 246 miles on a single charge. It can be charged using a standard 120-volt outlet, a 240-volt outlet, or a DC fast charger.
The I-Pace is available in two trim levels: I-Pace and I-Pace First Edition. The I-Pace comes standard with features like a 10.0-inch touchscreen infotainment system, a 12.3-inch digital instrument cluster, and a panoramic sunroof. The I-Pace First Edition adds more features, such as a Meridian sound system, a head-up display, and a wireless charging pad.
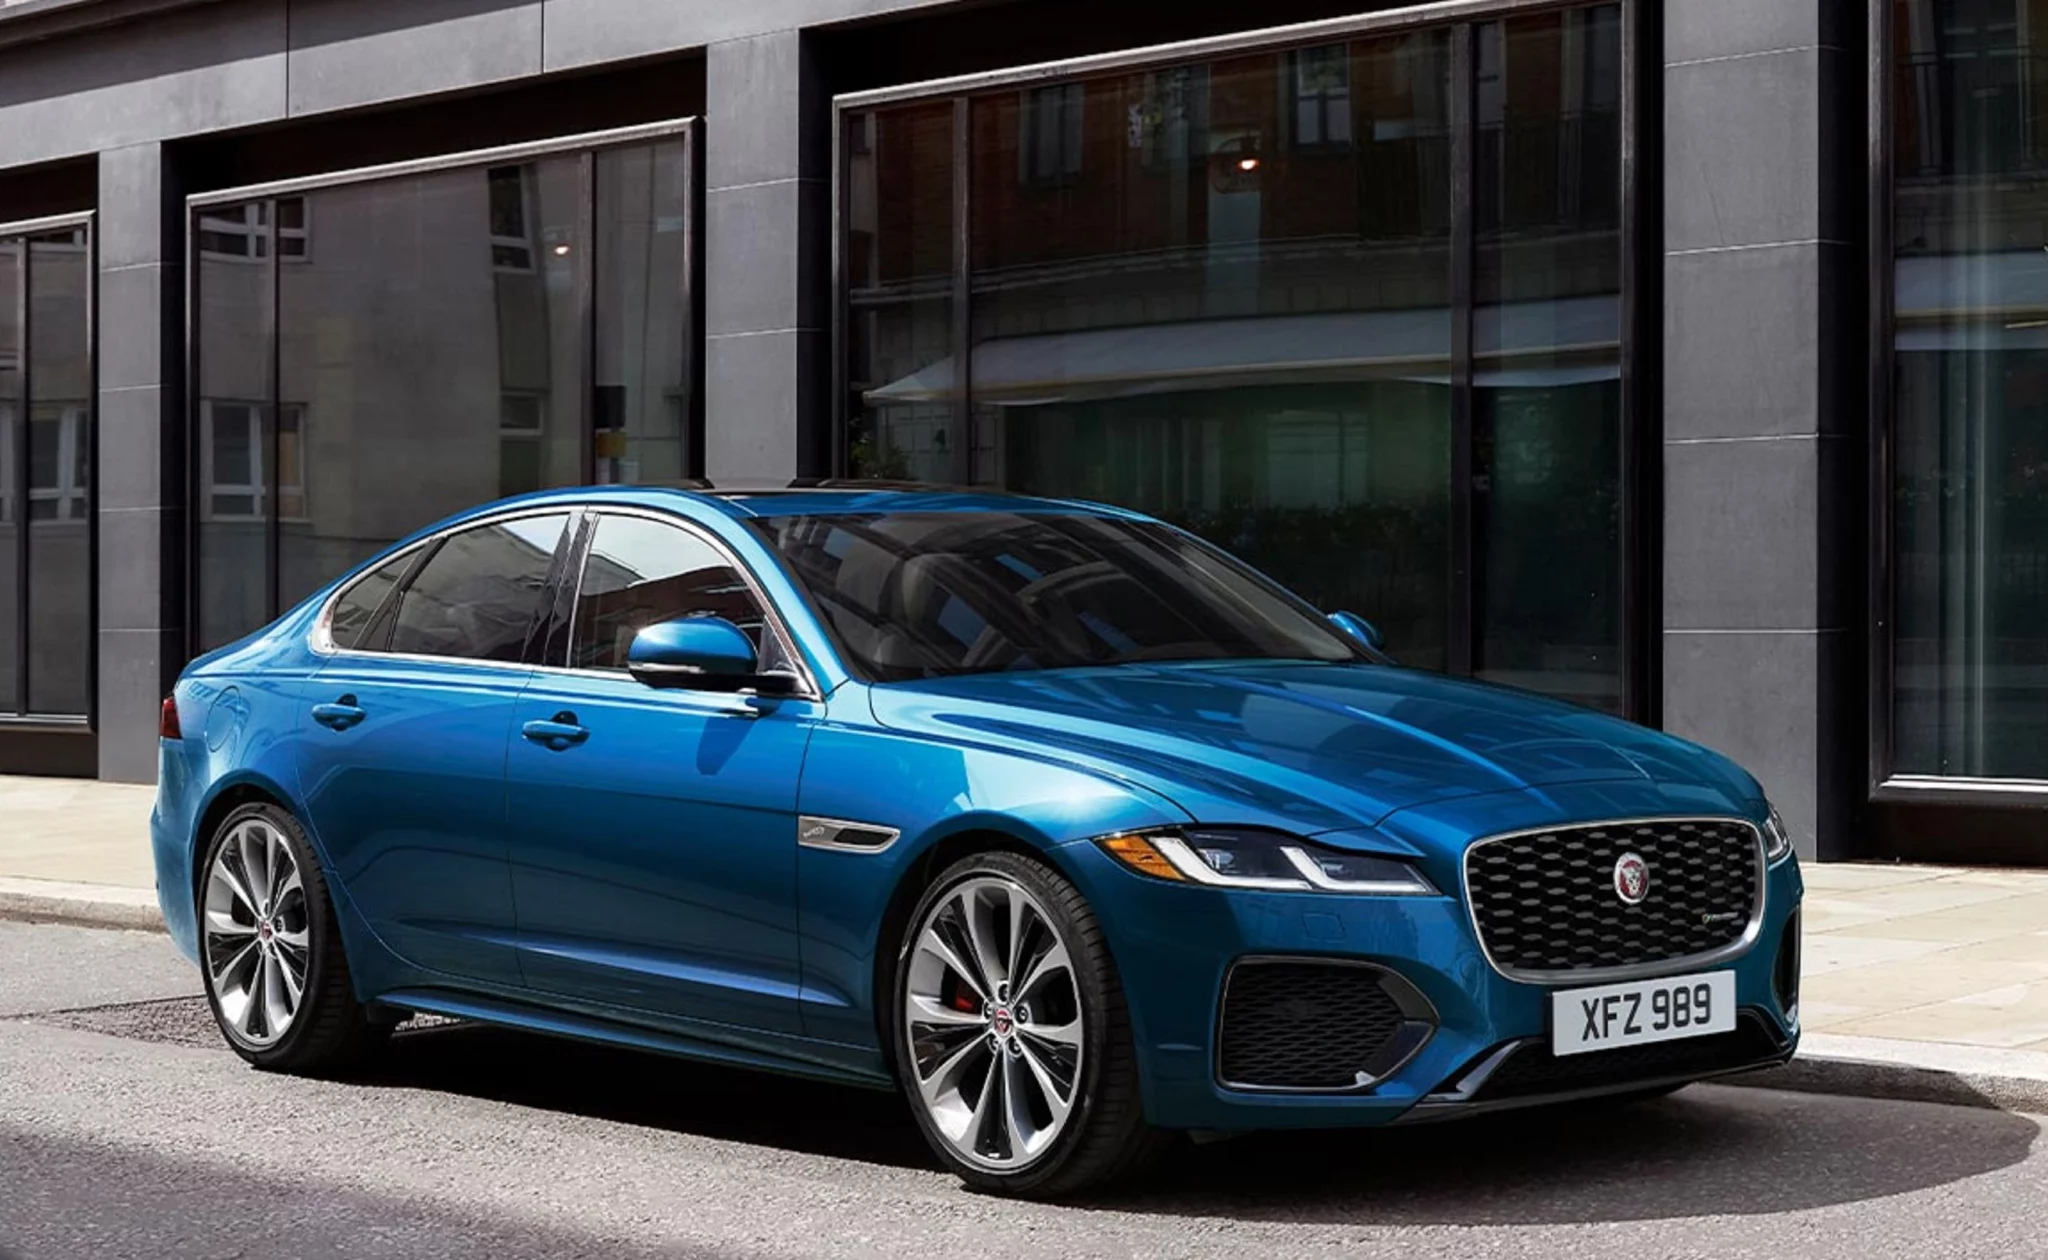
Jaguar XF
Starting at $49,800
The 2023 XF is available with two engine options: a 2.0L turbocharged inline-4 and a 3.0L supercharged V6. The 2.0L engine produces 247 horsepower and 269 lb-ft of torque, and the 3.0L engine produces 380 horsepower and 332 lb-ft of torque. Both engines are mated to an 8-speed automatic transmission. The XF is available in rear-wheel drive or all-wheel drive. It gets an EPA-estimated 22 mpg in the city and 29 mpg on the highway in rear-wheel drive, and 20 mpg in the city and 27 mpg on the highway in all-wheel drive.
The XF is available in four trim levels: S, SE, R-Dynamic S, and R-Dynamic HSE. The S is the base trim level, and it comes standard with features like a 10.0-inch touchscreen infotainment system, a 12.3-inch digital instrument cluster, and a panoramic sunroof. The SE trim adds more features, such as a heated steering wheel, a power-adjustable driver’s seat, and a hands-free power tailgate. The R-Dynamic S and R-Dynamic HSE trims are the most luxurious and performance-oriented trims, and they come standard with even more features, such as a sport-tuned suspension, upgraded brakes, and 20-inch wheels.
No major changes are expected for the 2024 Jaguar XF. However, Jaguar has announced that it will be discontinuing the XF in the United States after the 2023 model year. The company is focusing on its newer electric vehicles, such as the I-Pace and the upcoming EV SUV, the E-Pace.
Sources: Manufacturers, ANDC, JATO Dynamics.


