
Jaguar E-Pace
Here you will find monthly and yearly Canadian, European, Chinese and U.S. sales figures for the Jaguar E-Pace. The Jaguar E-PACE is a compact luxury SUV introduced by the British automaker Jaguar. Positioned as a smaller sibling to the Jaguar F-PACE, the E-PACE was designed to tap into the growing demand for premium compact SUVs while maintaining the brand’s heritage of stylish designs and engaging driving dynamics.
Jaguar E-Pace Overview
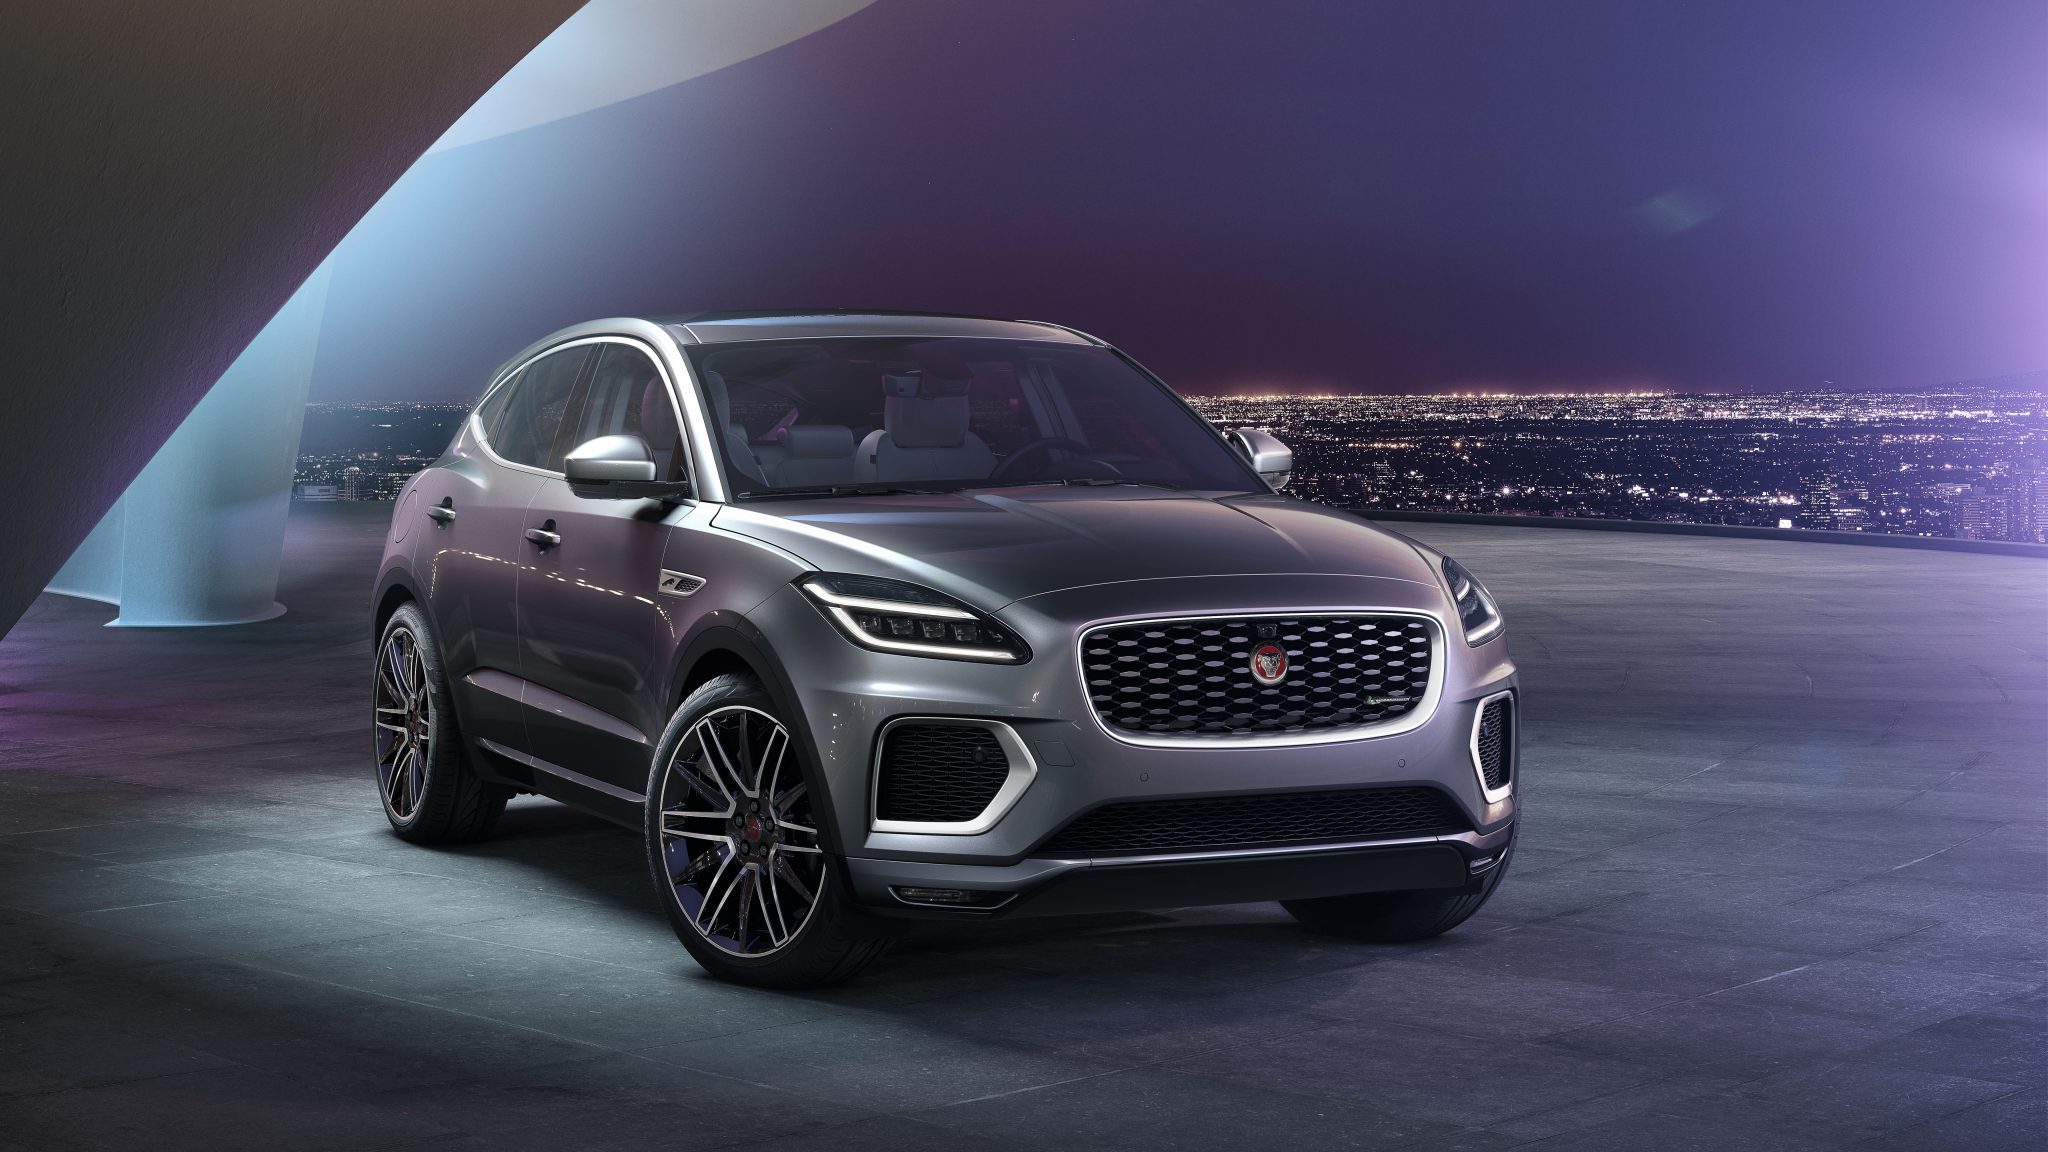
The E-PACE was unveiled in 2017, marking Jaguar’s continued expansion into the SUV segment after the successful launch of the F-PACE. The E-PACE takes design inspiration from the Jaguar F-Type sports car, featuring a sleek and aerodynamic look. This is evident in its teardrop shape, pronounced rear haunches, and distinctive headlamp design. The Jaguar E-Pace is a subcompact luxury crossover SUV.
The E-Pace is based on the same platform as the Land Rover Range Rover Evoque. It is powered by a variety of four-cylinder engines, including gasoline, diesel, and mild hybrid engines. A fully electric version, the E-Pace PHEV, is also available. It offers both front-wheel-drive and all-wheel-drive variants. The all-wheel-drive system can adapt to driving conditions, providing torque where needed for better traction and stability. Despite being an SUV, the E-PACE aims to provide the kind of sporty driving experience Jaguar is known for.
Jaguar E-Pace Sales Figures
The E-PACE entered a competitive segment that includes the likes of the BMW X1, Audi Q3, Mercedes-Benz GLA, and Volvo XC40, among others. It has been generally well-received for its design and driving dynamics, though some critics have highlighted points of comparison with its rivals in terms of interior space, tech, and overall value.
Jaguar E-Pace U.S Sales Data & Charts
US Monthly Sales
US Annual Sales
| Year | Sales Units |
|---|---|
| 2018 | 5,985 |
| 2019 | 4,782 |
| 2020 | 3,696 |
| 2021 | 2,904 |
| 2022 | 1,059 |
| 2023 | 528 |
| 2024 | 140 |
US Annual Growth
Jaguar E-Pace Canada Sales Data & Charts
Canada Annual Sales
Year Sales Units
2018
572
2019
417
2020
265
2021
98
Canada Annual Growth
Jaguar E-Pace Europe Sales Data & Charts
Europe Annual Sales
| Year | Sales Units |
|---|---|
| 2017 | 507 |
| 2018 | 27,735 |
| 2019 | 27,690 |
| 2020 | 14,847 |
| 2021 | 11,225 |
| 2022 | 4,973 |
Europe Annual Growth
Jaguar E-Pace China Sales Data & Charts
Jaguar has started local production of its first crossover E-Pace in the same Chery-Jaguar Land Rover factory where its sedan sibling XEL and XFL and the Range Rover Evoque and Land Rover Discovery Sport are made. The brand proudly mentions this factory features China’s first purpose-built aluminium body shop.
China Annual Sales
| Year | Sales Units |
|---|---|
| 2018 | 2,200 |
| 2019 | 2,328 |
| 2020 | 2,249 |
| 2021 | 695 |


