
Hyundai Sales Data, Trends, Analysis & Current Lineup for the U.S Automotive Market
This is your hub for all of the Hyundai sales data for the U.S market. The Hyundai Motor Group is now the largest vehicle manufacturer in South Korea and in 2019 became the third-largest vehicle manufacturer in the world, after Toyota and Volkswagen. Though Hyundai has quite a complicated history, the one thing about its models that has never been questioned is the dependability of the cars they produce.
Hyundai as a brand was always seen as being cheaper cars. In recent years, however, Hyundai has worked hard and invested a lot of money in creating high quality but still highly affordable cars in order to escape that perception. Hyundai is now a car maker focused on great value for money.
For example, Hyundai offers many features that are normally only found on high end luxury models, such as leather interior or heated seats, but at a much more affordable price. Hyundai vehicles are now being ranked close to the top of every class of vehicle, but are thousands of dollars cheaper than those ranked ahead of them. It’s all about value for money. Hyundai produces its best selling US models Elantra and Sonata in its Montgomery, AL factory and the Santa Fe in sister brand Kia’s West Point, GA factory, while its other models for the US market are imported from its factories in South Korea. The Hyundai Elantra compact car has been the best selling model for the brand in the United States, while the Tucson compact crossover is Hyundai’s best selling SUV.
Hyundai U.S Sales Figures & Recent Highlights
Hyundai-branded vehicles has been sold in North America since 1986. The first car sold in the US was the Hyundai Excel which was produced in South Korea and then exported to North America. The brand became an instant success in the US even in its first year of business in the country. In 1986, Hyundai sold 168,882 vehicles in the US to become the best-selling automobile brand that year. Today, Hyundai is among the best selling car brands in the US. In 2018, Hyundai-branded vehicles holds 4% of the car market in the US. Their sales in 2010s has been much better than in 2000s. In 2016, the brand sold 768,057, a record for Hyundai.
Hyundai has been one of the best-selling car brands in the US in recent years. It has continued to grow and maintain a roughly 4% market share in the U.S. Hyundai’s U.S. sales have been robust, especially as the automaker shifted its lineup to cater to the American preference for SUVs and crossovers. Some models, like the Tucson, Santa Fe, and Palisade, have been particularly well-received. Hyundai’s sedan offerings, such as the Elantra and Sonata, also continued to perform solidly despite the industry trend leaning towards SUVs.
In 2022, Hyundai sales in the US totaled 716,911 vehicles, down slightly (-1.35%) from 2021. Hyundai is a strong brand with a bright future. The company is continuing to innovate and introduce new and exciting vehicles. I am confident that Hyundai will continue to be one of the best-selling car brands in the US in the years to come.
Hyundai Monthly Sales Data in the U.S
Below we have a table that shows Hyundai sales for the United States automotive market, but this time it is broken out by month. This is on a unit basis. This is Hyundai new vehicle sales in the US.
Hyundai Annual Sales, Growth & Market Share in the United States
Below we have a table that shows total Hyundai sales volumes for the US automotive market, broken out by year. This data captures all Hyundai vehicle sales for the entire United States automotive market.
| Year | Sales | YOY Change | US Marketshare | Marketshare Change |
|---|---|---|---|---|
| 1990 | 7,018 | 0.00 | 0.23 | 0.00 |
| 1991 | 26,421 | 276.47 | 0.96 | 75.82 |
| 1992 | 17,196 | -34.92 | 0.66 | -45.56 |
| 1993 | 15,420 | -10.33 | 0.56 | -18.19 |
| 1994 | 15,365 | -0.36 | 0.64 | 12.22 |
| 1995 | 4,780 | -68.89 | 0.18 | -264.40 |
| 1996 | 458 | -90.42 | 0.02 | -955.40 |
| 1997 | 9 | -98.03 | 0.00 | -5,256.14 |
| 1998 | 0 | -100.00 | 0.00 | 0.00 |
| 1999 | 0 | 0.00 | 0.00 | 0.00 |
| 2000 | 0 | 0.00 | 0.00 | 0.00 |
| 2001 | 0 | 0.00 | 0.00 | 0.00 |
| 2002 | 0 | 0.00 | 0.00 | 0.00 |
| 2003 | 0 | 0.00 | 0.00 | 0.00 |
| 2004 | 0 | 0.00 | 0.00 | 0.00 |
| 2005 | 458,012 | 0.00 | 2.68 | 100.00 |
| 2006 | 455,520 | -0.54 | 2.73 | 2.09 |
| 2007 | 467,009 | 2.52 | 2.88 | 5.06 |
| 2008 | 401,742 | -13.98 | 3.01 | 4.47 |
| 2009 | 434,066 | 8.05 | 4.13 | 27.05 |
| 2010 | 538,031 | 23.95 | 4.59 | 10.01 |
| 2011 | 645,974 | 20.06 | 5.00 | 8.18 |
| 2012 | 736,733 | 14.05 | 4.72 | -5.94 |
| 2013 | 720,883 | -2.15 | 4.60 | -2.58 |
| 2014 | 725,718 | 0.67 | 4.39 | -4.81 |
| 2015 | 761,710 | 4.96 | 4.35 | -0.83 |
| 2016 | 768,057 | 0.83 | 4.37 | 0.29 |
| 2017 | 664,942 | -13.43 | 3.85 | -13.43 |
| 2018 | 679,127 | 2.13 | 3.91 | 1.53 |
| 2019 | 688,771 | 1.42 | 4.04 | 3.24 |
| 2020 | 619,925 | -10.00 | 4.21 | 4.15 |
| 2021 | 726,715 | 17.23 | 4.86 | 13.28 |
| 2022 | 716,911 | -1.35 | 5.24 | 7.21 |
| 2023 | 796,506 | 11.10 | 5.13 | -2.16 |
| 2024 | 184,804 | 0.00 | 4.87 | 0.00 |
Hyundai U.S Annual Sales Units & Growth Chart
Below is a visual representation of Hyundai’s U.S sales units over time. We have both the Hyundai sales units and the growth in the United States market. Click on the items in the legend to see each series by itself.
Hyundai U.S Growth Rate & Market Share Chart
Below is the annual growth rate for the Hyundai brand in the United States, shown against the Hyundai’s marketshare changes in the United States. This gives you a good look into how Hyundai has faired against the other brands in terms of absolute sales and effect on marketshare. Click on the items in the legend to see each series by itself.
The Best-Selling Hyundai Cars & SUVs in the United States
Hyundai vehicles are known for being reliable and fuel-efficient. This is important to many buyers, especially in the current economic climate. Hyundai has been running aggressive marketing campaigns in the US. This has helped to raise awareness of the brand and its vehicles. The top sellers had another stellar year and continue to maintain strong market shares.
- Hyundai Tucson (175,307 sold in 2022).The current Hyundai Tucson is a midsize SUV that was first introduced in 2021. It is known for its stylish design, comfortable ride, and long list of features. The Tucson is a good choice for those who are looking for a stylish, comfortable, and fuel-efficient midsize SUV.
- Hyundai Elantra (117,177 sold in 2022).The 2024 Hyundai Elantra is a compact sedan that is all-new for the 2024 model year. It is larger and more spacious than the previous generation, and it features a more modern design. The 2024 Elantra is a good choice for those who are looking for a stylish and fuel-efficient compact sedan. It is also a good choice for those who are looking for a vehicle with a long list of features.
- Hyundai Santa Fe (115,226 sold in 2022). The 2024 Hyundai Santa Fe is a midsize SUV that is all-new for the 2024 model year. It is larger and more spacious than the previous generation, and it features a more modern design. The 2024 Santa Fe is a good choice for those who are looking for a spacious and comfortable midsize SUV. It is also a good choice for those who are looking for a vehicle with a long list of features.
- Hyundai Palisade (82,688 sold in 2022). The Hyundai Palisade is a full-size SUV that was first introduced in 2018. It is known for its spacious and comfortable interior, long list of features, and smooth ride. The Palisade is a good choice for those who are looking for a spacious and comfortable full-size SUV. It is also a good choice for those who are looking for a vehicle with a long list of features.
- Hyundai Kona (63,994 sold in 2022). The current Hyundai Kona is a subcompact crossover SUV that was first introduced in 2018. It is known for its stylish design, fuel efficiency, and available all-wheel drive. The Hyundai Kona is a good choice for those who are looking for a stylish, fuel-efficient, and versatile subcompact SUV. It is also a good choice for those who live in areas with cold winters, as it is available with all-wheel drive.
The Current Hyundai Model Lineup & Prices in the U.S
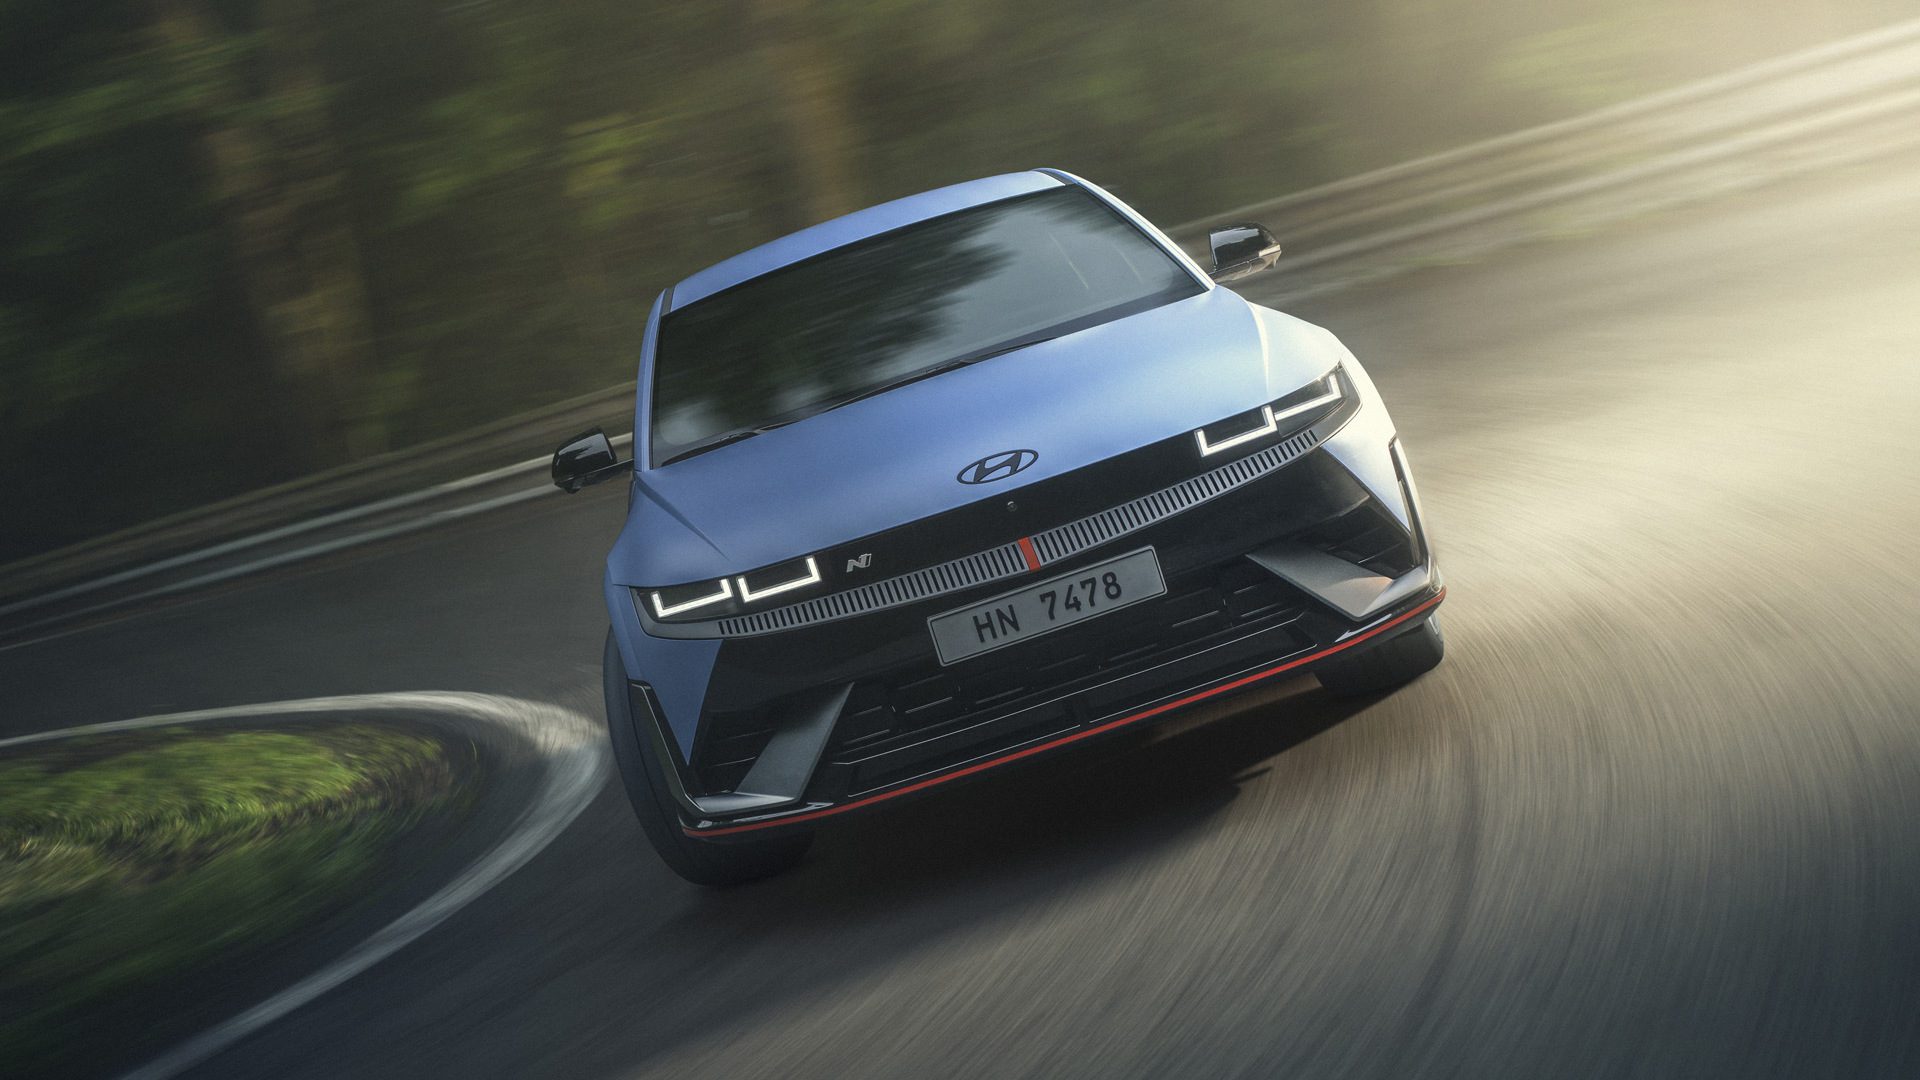
Hyundai offers a wide range of vehicles to choose from, including sedans, SUVs, crossovers, and trucks. This allows the brand to appeal to a wide range of buyers. Hyundai is constantly introducing new and innovative features in its vehicles. This helps to keep the brand ahead of the competition. Recognizing the American appetite for SUVs, Hyundai expanded its SUV lineup with models spanning various segments. The Hyundai Palisade, for example, was introduced as a larger three-row SUV to cater to families needing more space. Hyundai has been pushing its performance-oriented “N” and “N Line” models, trying to appeal to enthusiasts and younger drivers. The Veloster N was one of the first to showcase this performance emphasis, with other models like the Sonata N Line and Elantra N following suit.
Hyundai has been actively investing in alternative powertrains, including hybrids, plug-in hybrids, electric, and even hydrogen fuel cell technology. The Hyundai Ioniq was a key model in this strategy, and Hyundai announced plans for an entire Ioniq sub-brand dedicated to electric vehicles. As part of Hyundai’s strategy to bolster its electric vehicle offerings, the automaker announced the Ioniq sub-brand. This brand will encompass various electric models, starting with the Ioniq 5, a midsize crossover EV, followed by other models like the Ioniq 6 sedan and Ioniq 7 SUV.
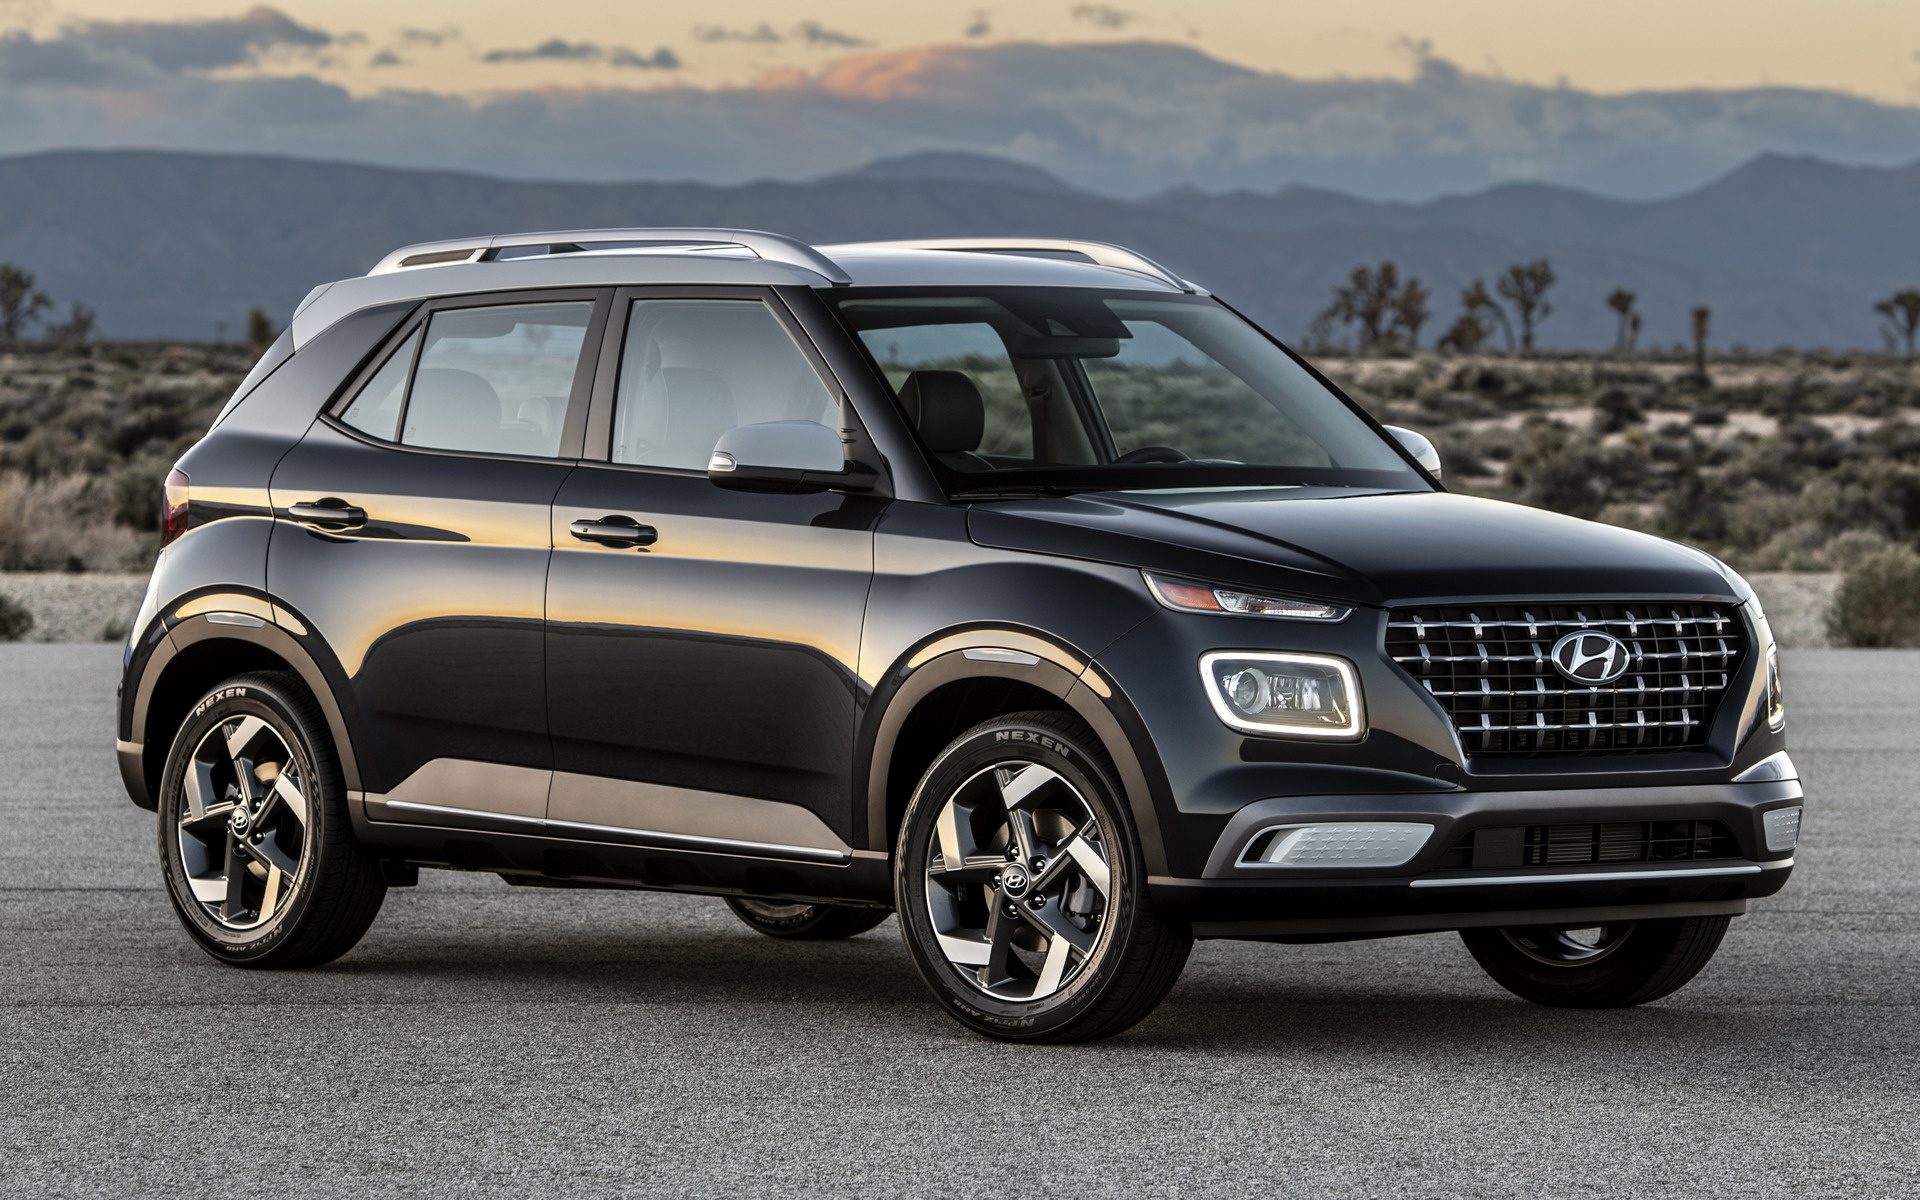
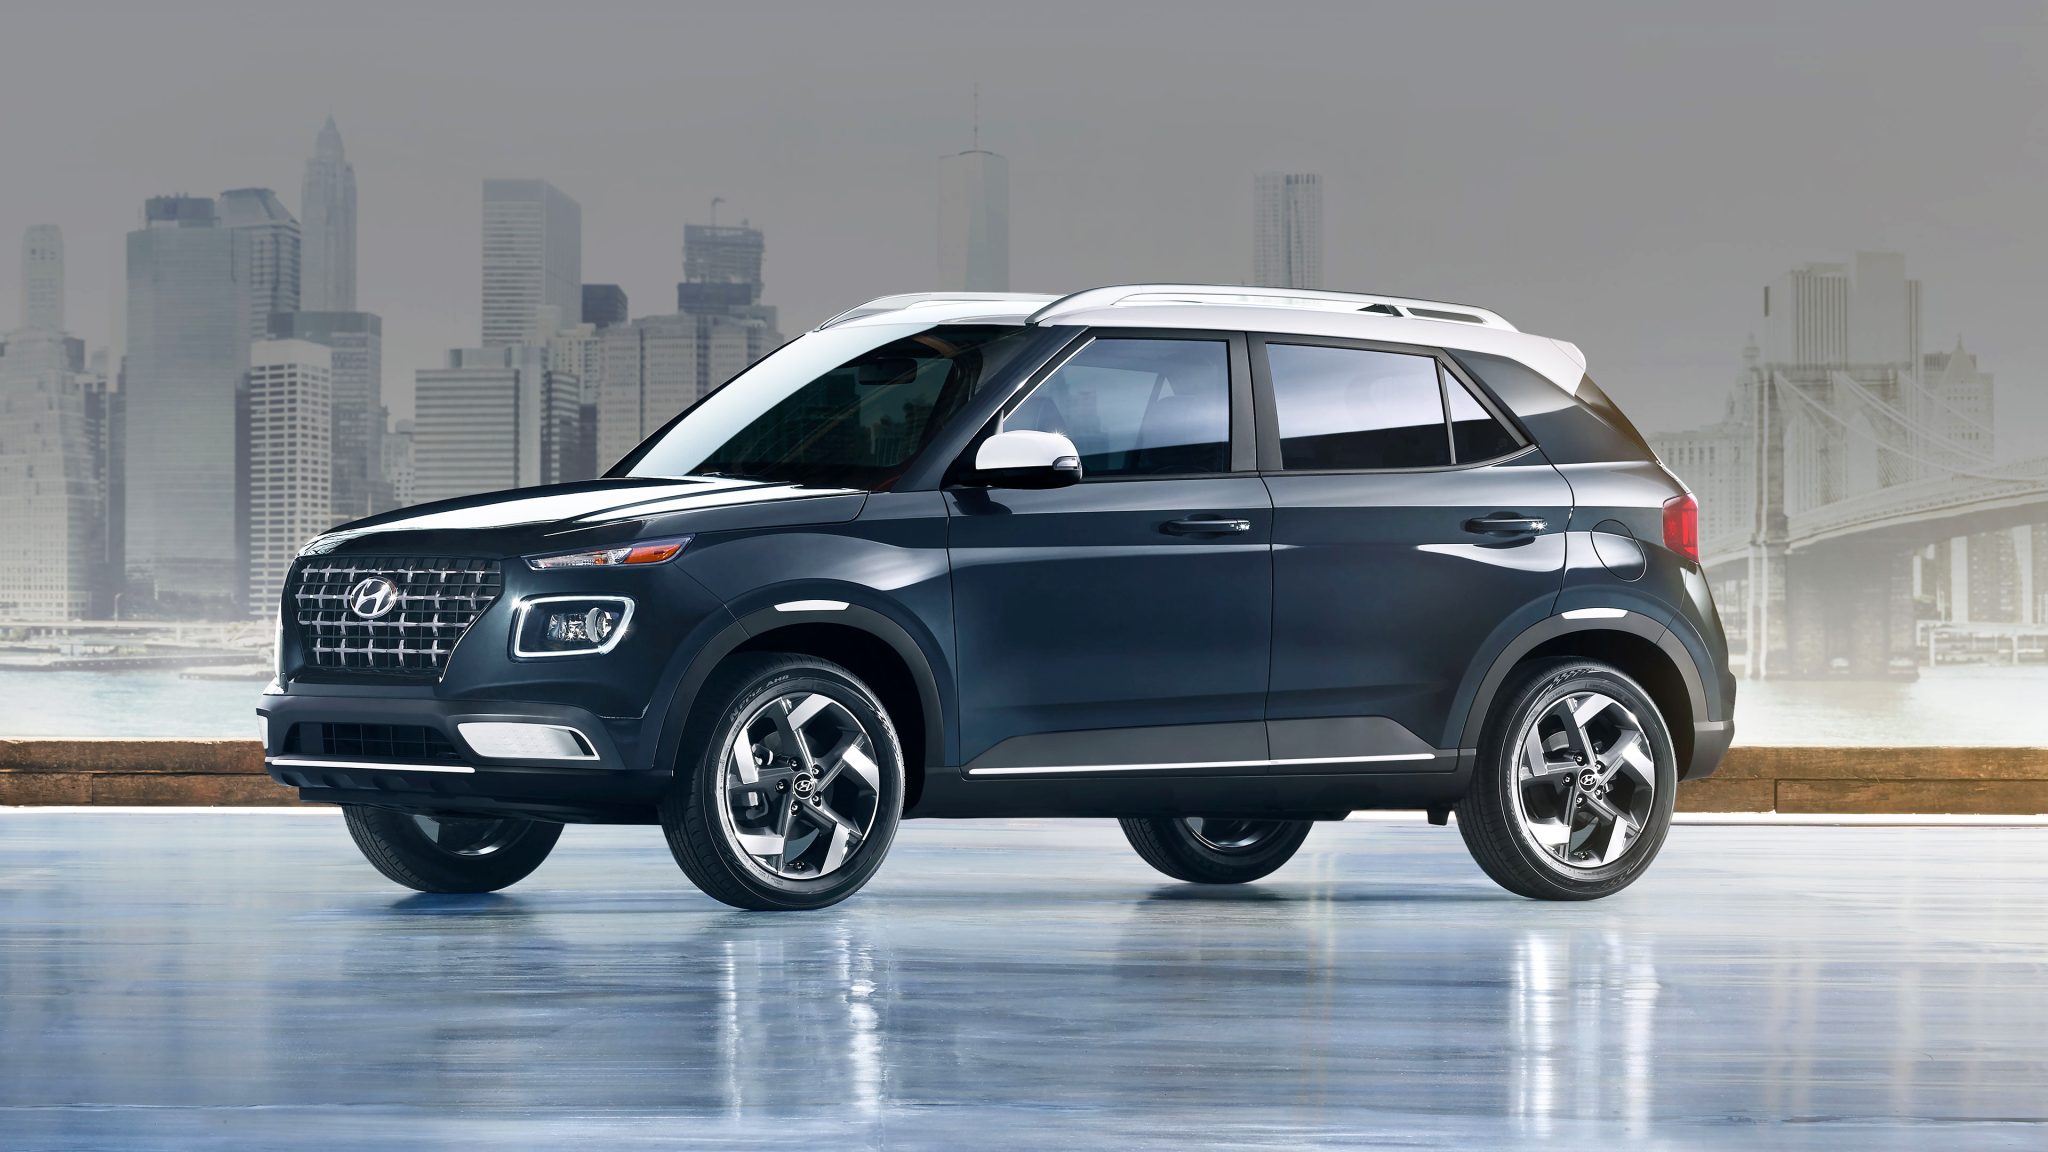
Hyundai Venue
Starting at $19,650
The current Hyundai Venue is a subcompact crossover SUV that was first introduced in 2019. It is known for its stylish design, fuel efficiency, and affordability.
The 2023 Venue is available in four trim levels: SE, SEL, Limited, and N Line. The SE is the base model and comes standard with features like a 8-inch touchscreen infotainment system, a 6-speaker sound system, and a rearview camera. The SEL adds features like a 10.25-inch digital instrument cluster, an 8-speaker Infinity sound system, and heated front seats. The Limited is the luxury-oriented model and comes standard with features like a leather-wrapped steering wheel, a panoramic sunroof, and a Bose sound system. The N Line is the sporty-oriented model and comes standard with features like a sport-tuned suspension, a unique front fascia, and 18-inch alloy wheels.
The Venue is powered by a 1.6L four-cylinder engine that produces 123 horsepower and 154 lb-ft of torque. It is mated to a continuously variable automatic transmission (CVT). The Venue gets an EPA-estimated 29 mpg in the city and 37 mpg on the highway.
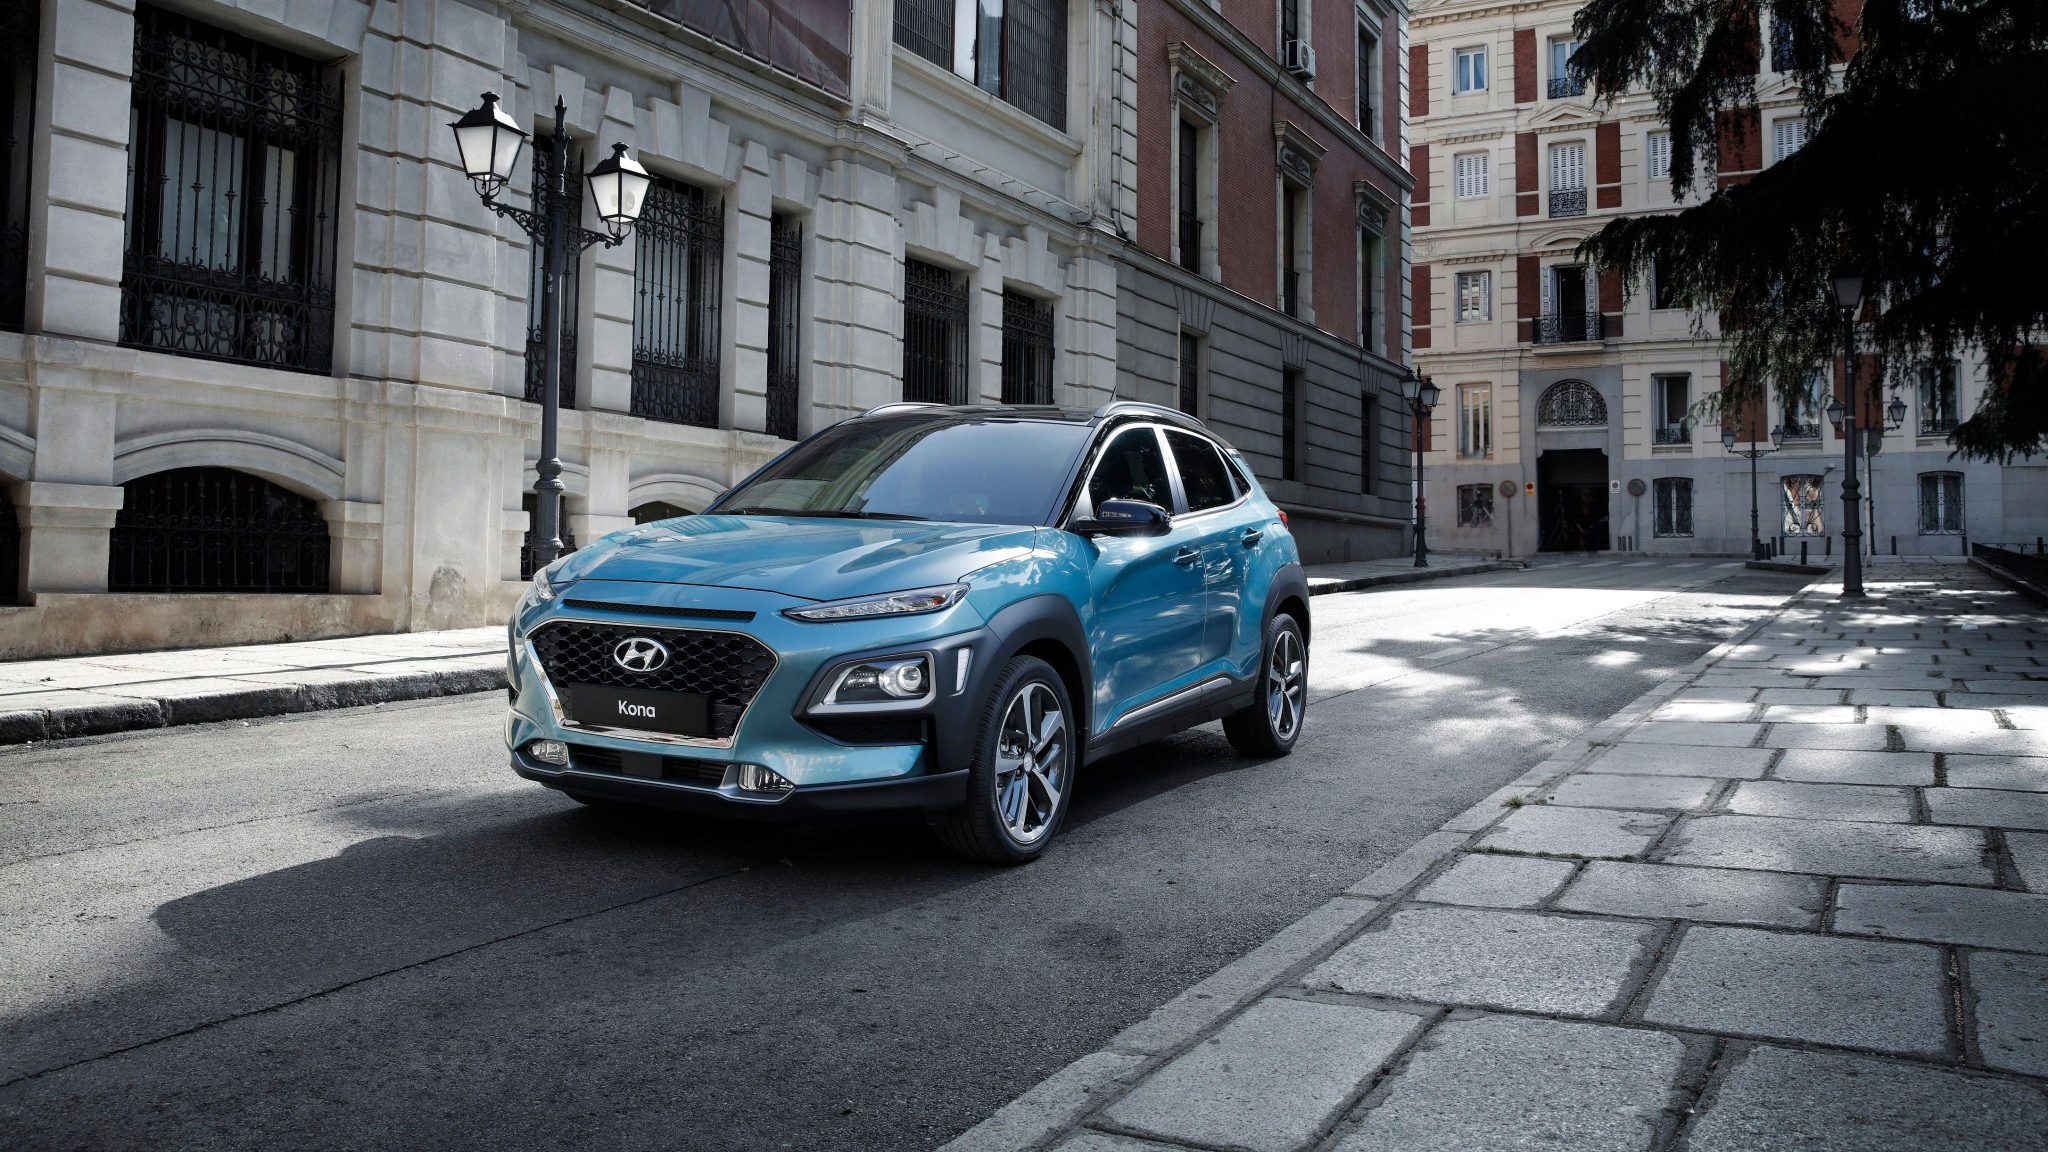
Hyundai Kona
Starting at $30,650
The 2023 Kona is available in three trim levels: SE, SEL, and Limited. The SE is the base model and comes standard with features like a 8-inch touchscreen infotainment system, a 6-speaker sound system, and a rearview camera. The SEL adds features like a 10.25-inch digital instrument cluster, an 8-speaker Infinity sound system, and heated front seats. The Limited is the luxury-oriented model and comes standard with features like a leather-wrapped steering wheel, a panoramic sunroof, and a Bose sound system.
The Kona is available with two engine options: a 2.0L four-cylinder engine that produces 147 horsepower and 132 lb-ft of torque, or a 1.6L turbocharged four-cylinder engine that produces 177 horsepower and 195 lb-ft of torque. Both engines are mated to a continuously variable automatic transmission (CVT). The Kona gets an EPA-estimated 28 mpg in the city and 33 mpg on the highway with the base engine, and 27 mpg in the city and 32 mpg on the highway with the turbocharged engine.
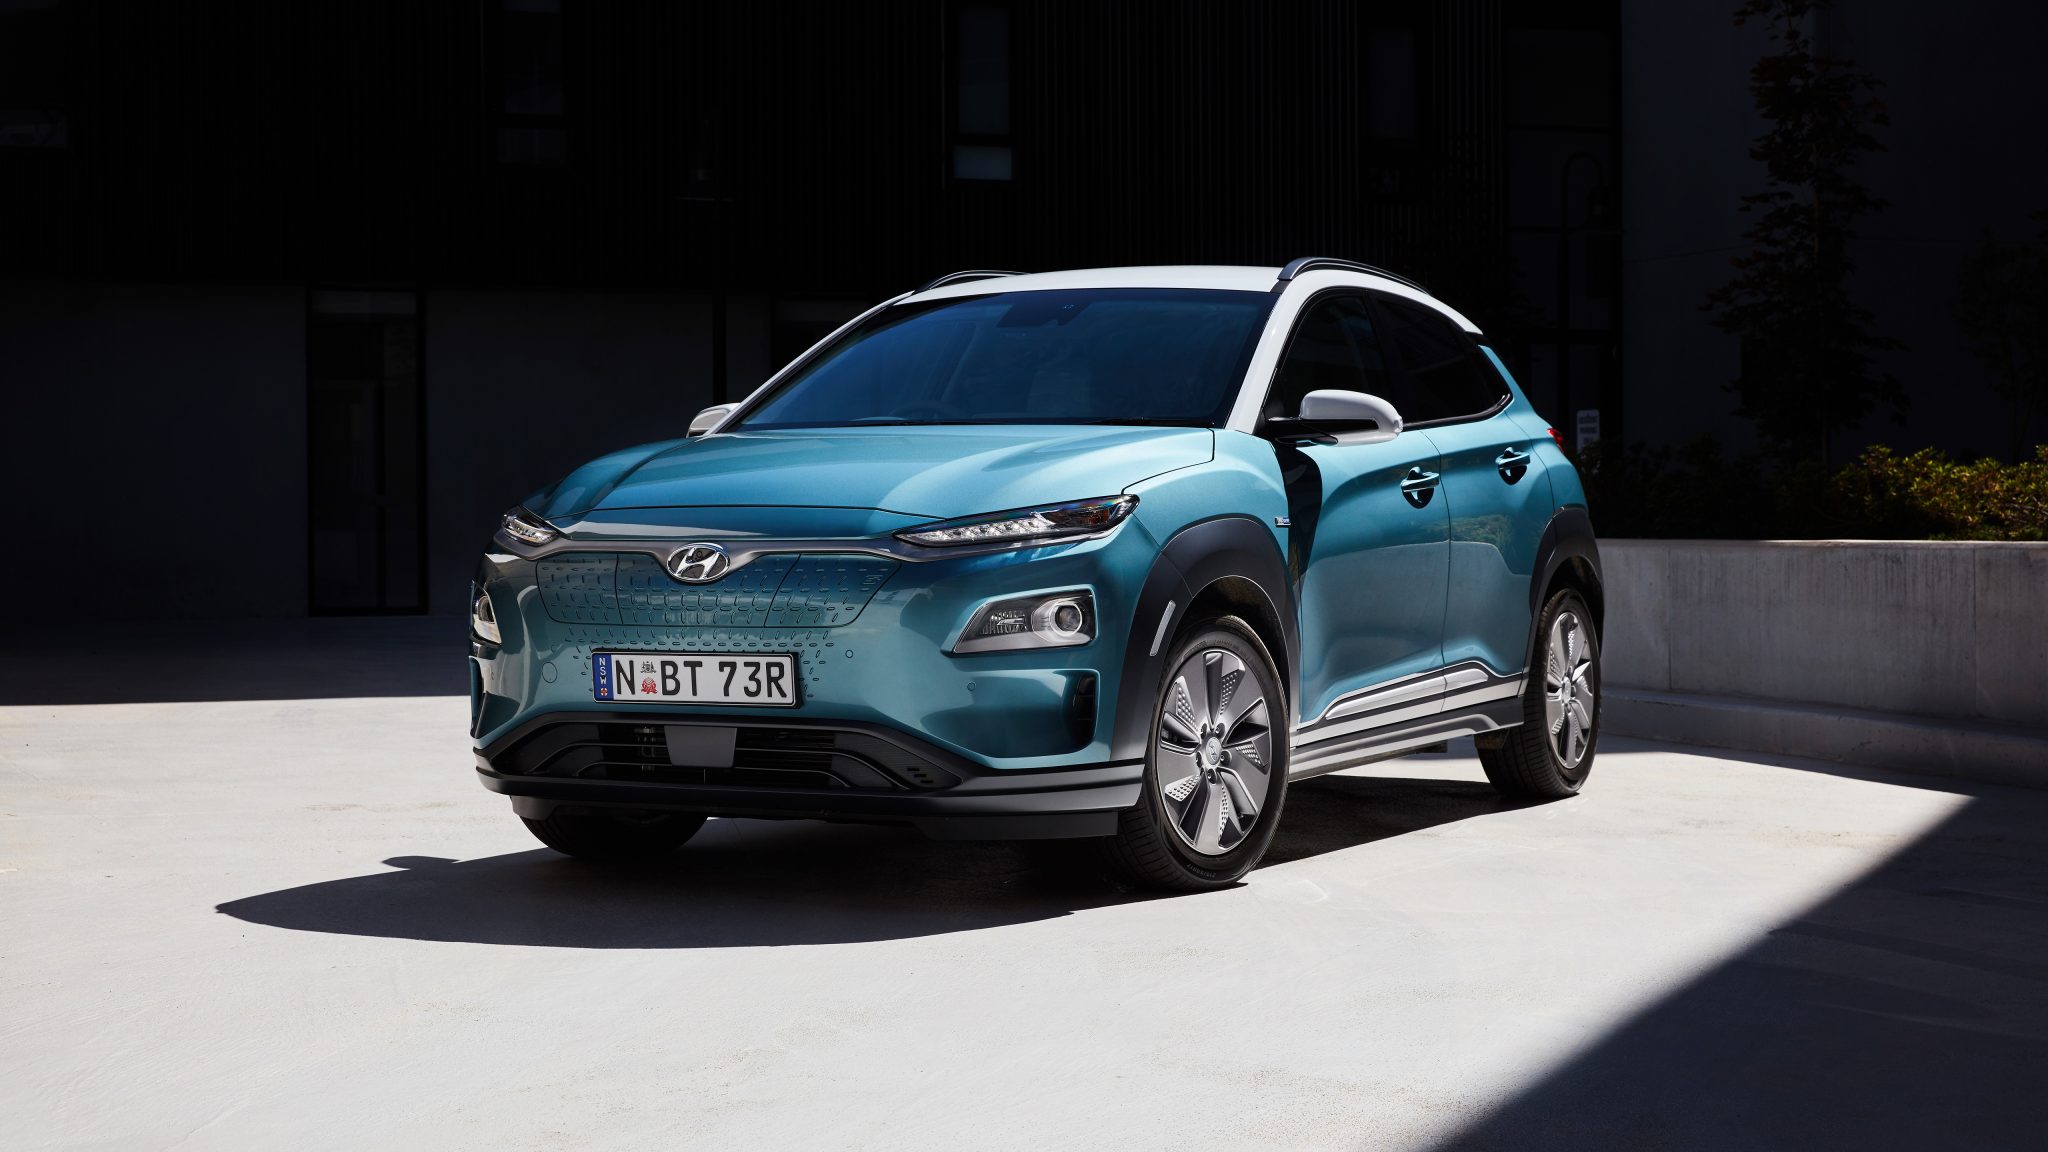
Hyundai Kona Electric
Starting at $33,550
The Hyundai Kona Electric is an all-electric subcompact SUV that was first introduced in 2018. It is known for its long range and stylish design. The 2023 Kona Electric is available in two trim levels: SEL and Limited. The SEL is the base model and comes standard with features like a 10.25-inch touchscreen infotainment system, an 8-speaker Infinity sound system, and heated front seats. The Limited is the luxury-oriented model and comes standard with features like a leather-wrapped steering wheel, a panoramic sunroof, and a Bose sound system. The Kona Electric is powered by a 64.0-kWh battery pack that provides an EPA-estimated range of 258 miles. It is mated to a single electric motor that produces 201 horsepower and 291 lb-ft of torque. The Kona Electric can go from 0 to 60 mph in 7.6 seconds.
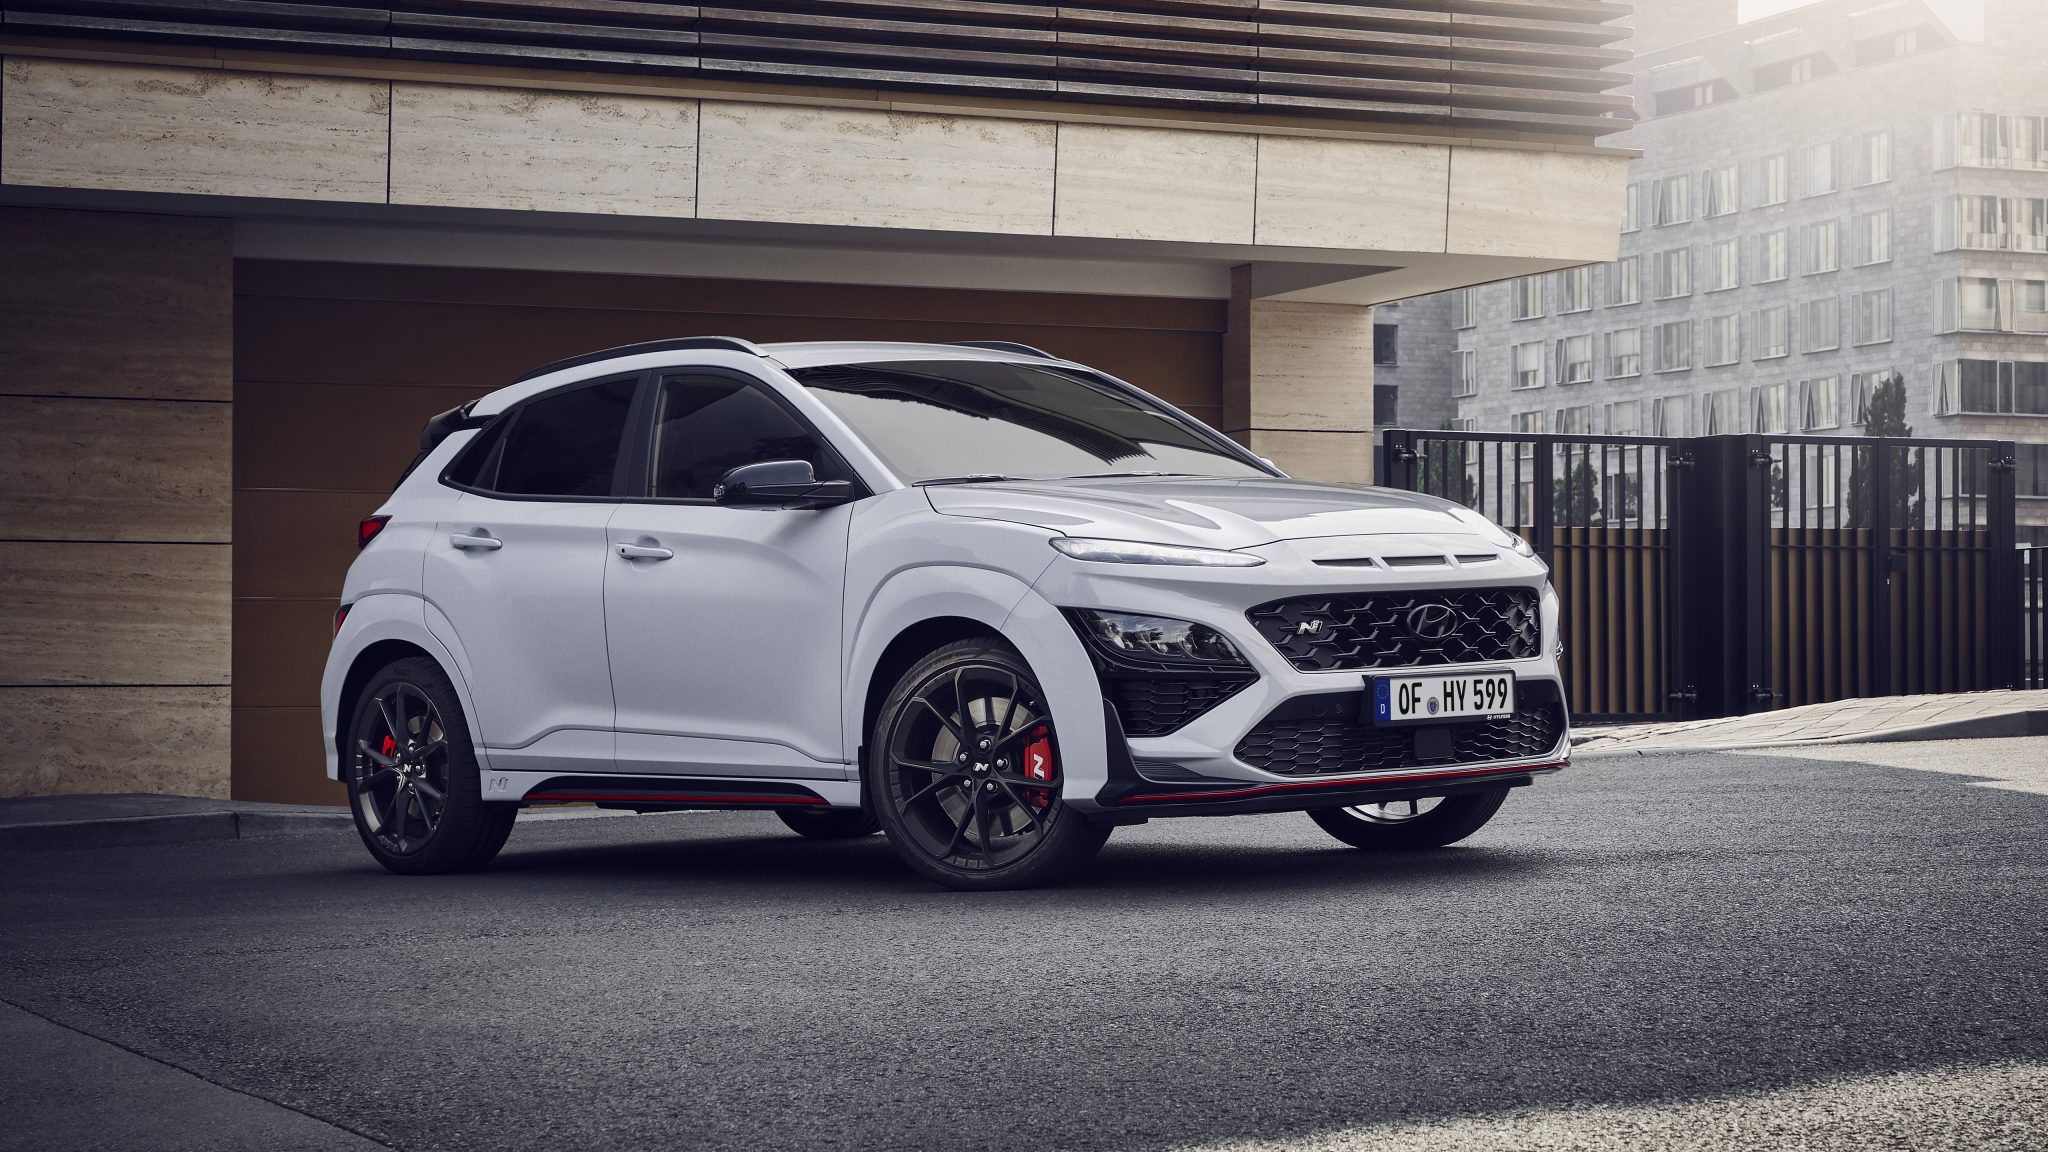
Hyundai Kona N
Starting at $34,950
The Hyundai Kona N is a performance version of the Hyundai Kona subcompact SUV that was first introduced in 2022. It is powered by a 2.0L turbocharged four-cylinder engine that produces 276 horsepower and 289 lb-ft of torque. It is mated to an eight-speed dual-clutch transmission (DCT). The Kona N can go from 0 to 60 mph in 5.5 seconds. The Kona N also comes standard with features like a 10.25-inch touchscreen infotainment system, an 8-speaker Harman Kardon sound system, and heated front seats.
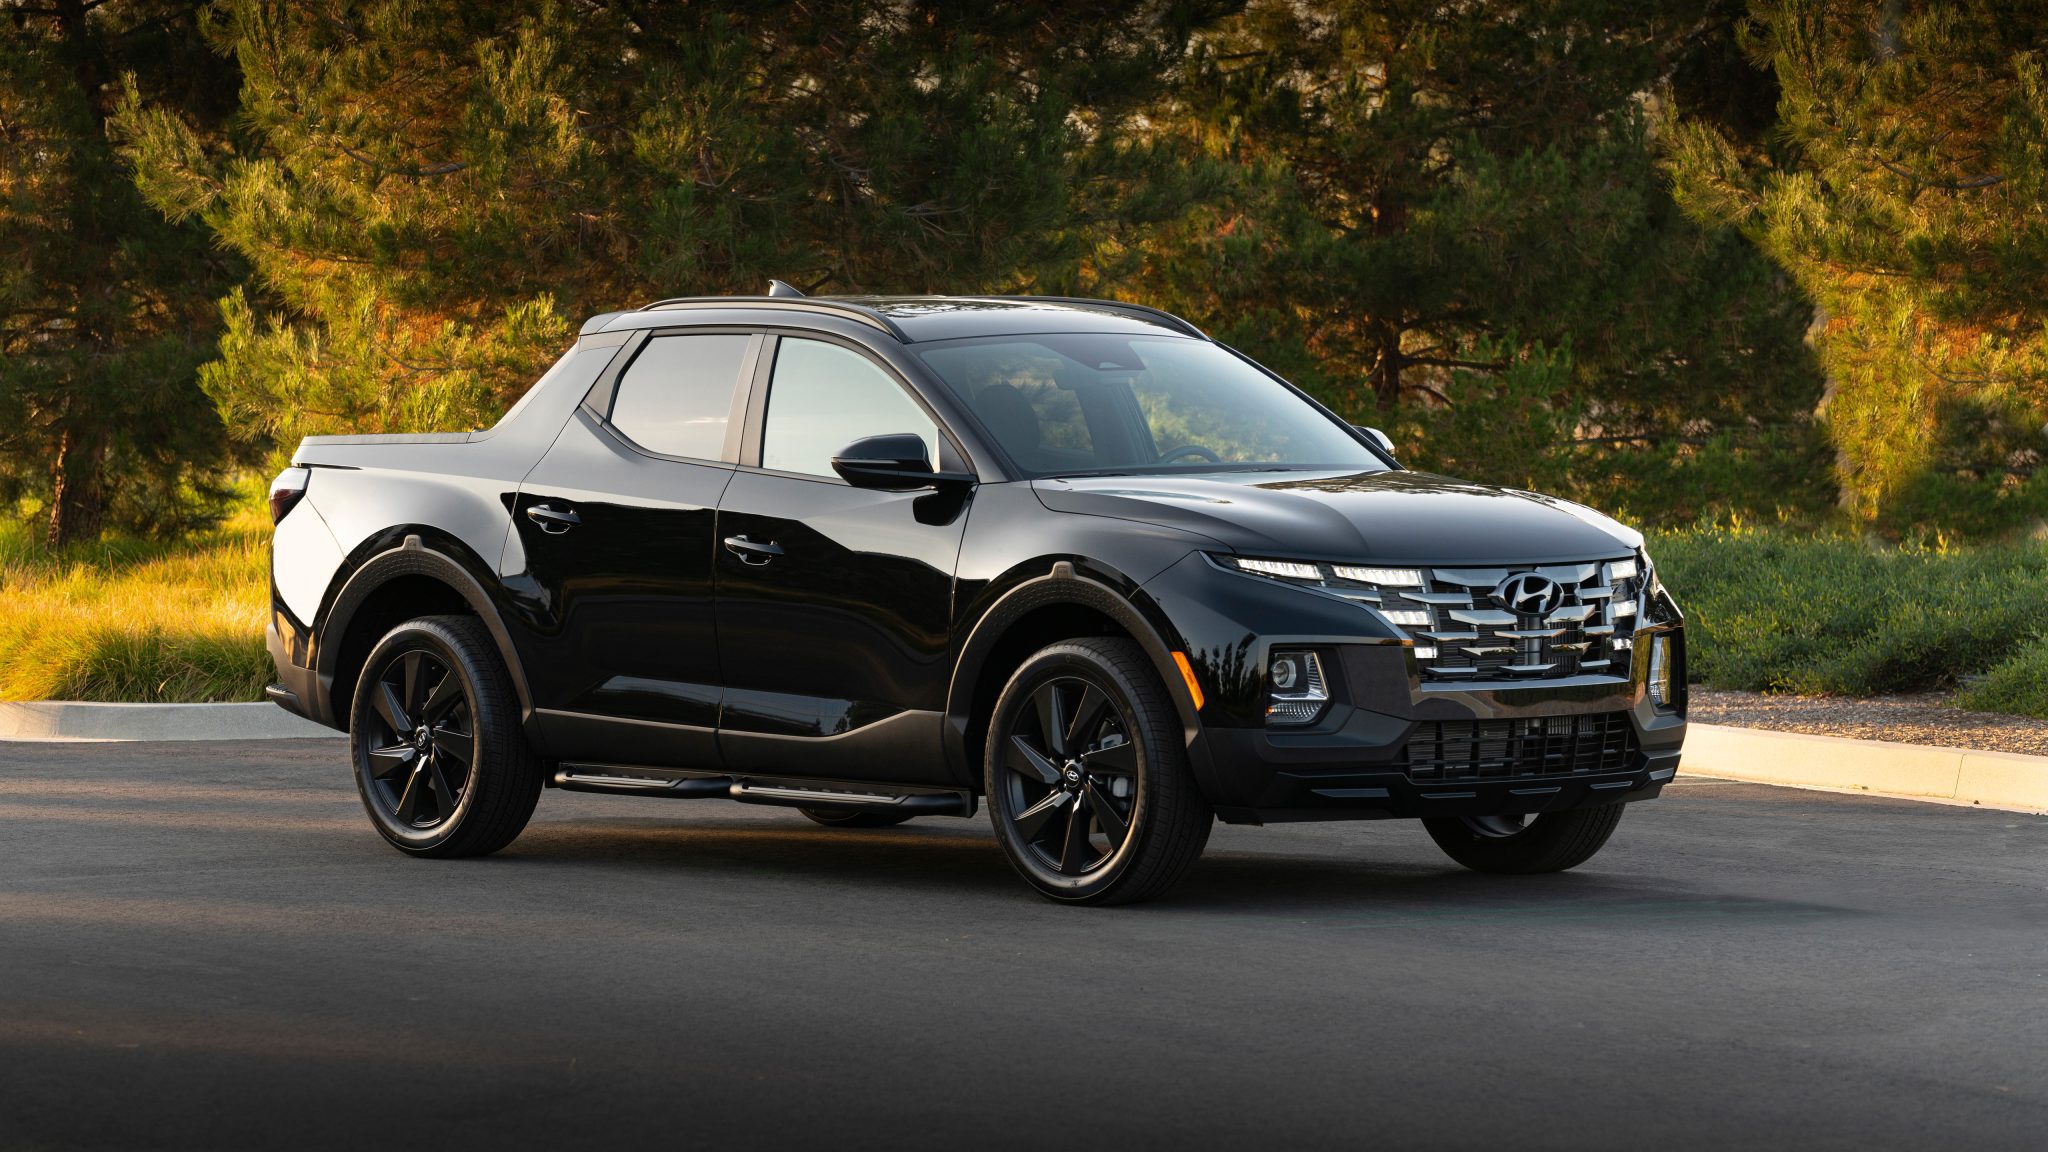
Hyundai Santa Cruz
Starting at $26,650
The Hyundai Santa Cruz is a midsize pickup truck that was first introduced in 2022. It is a unique vehicle that combines the features of an SUV and a pickup truck. The Santa Cruz is available with two engine options: a 2.5L four-cylinder engine that produces 191 horsepower and 181 lb-ft of torque, or a 2.5L turbocharged four-cylinder engine that produces 281 horsepower and 311 lb-ft of torque. Both engines are mated to an eight-speed automatic transmission. The Santa Cruz gets an EPA-estimated 23 mpg in the city and 30 mpg on the highway with the base engine, and 19 mpg in the city and 27 mpg on the highway with the turbocharged engine.
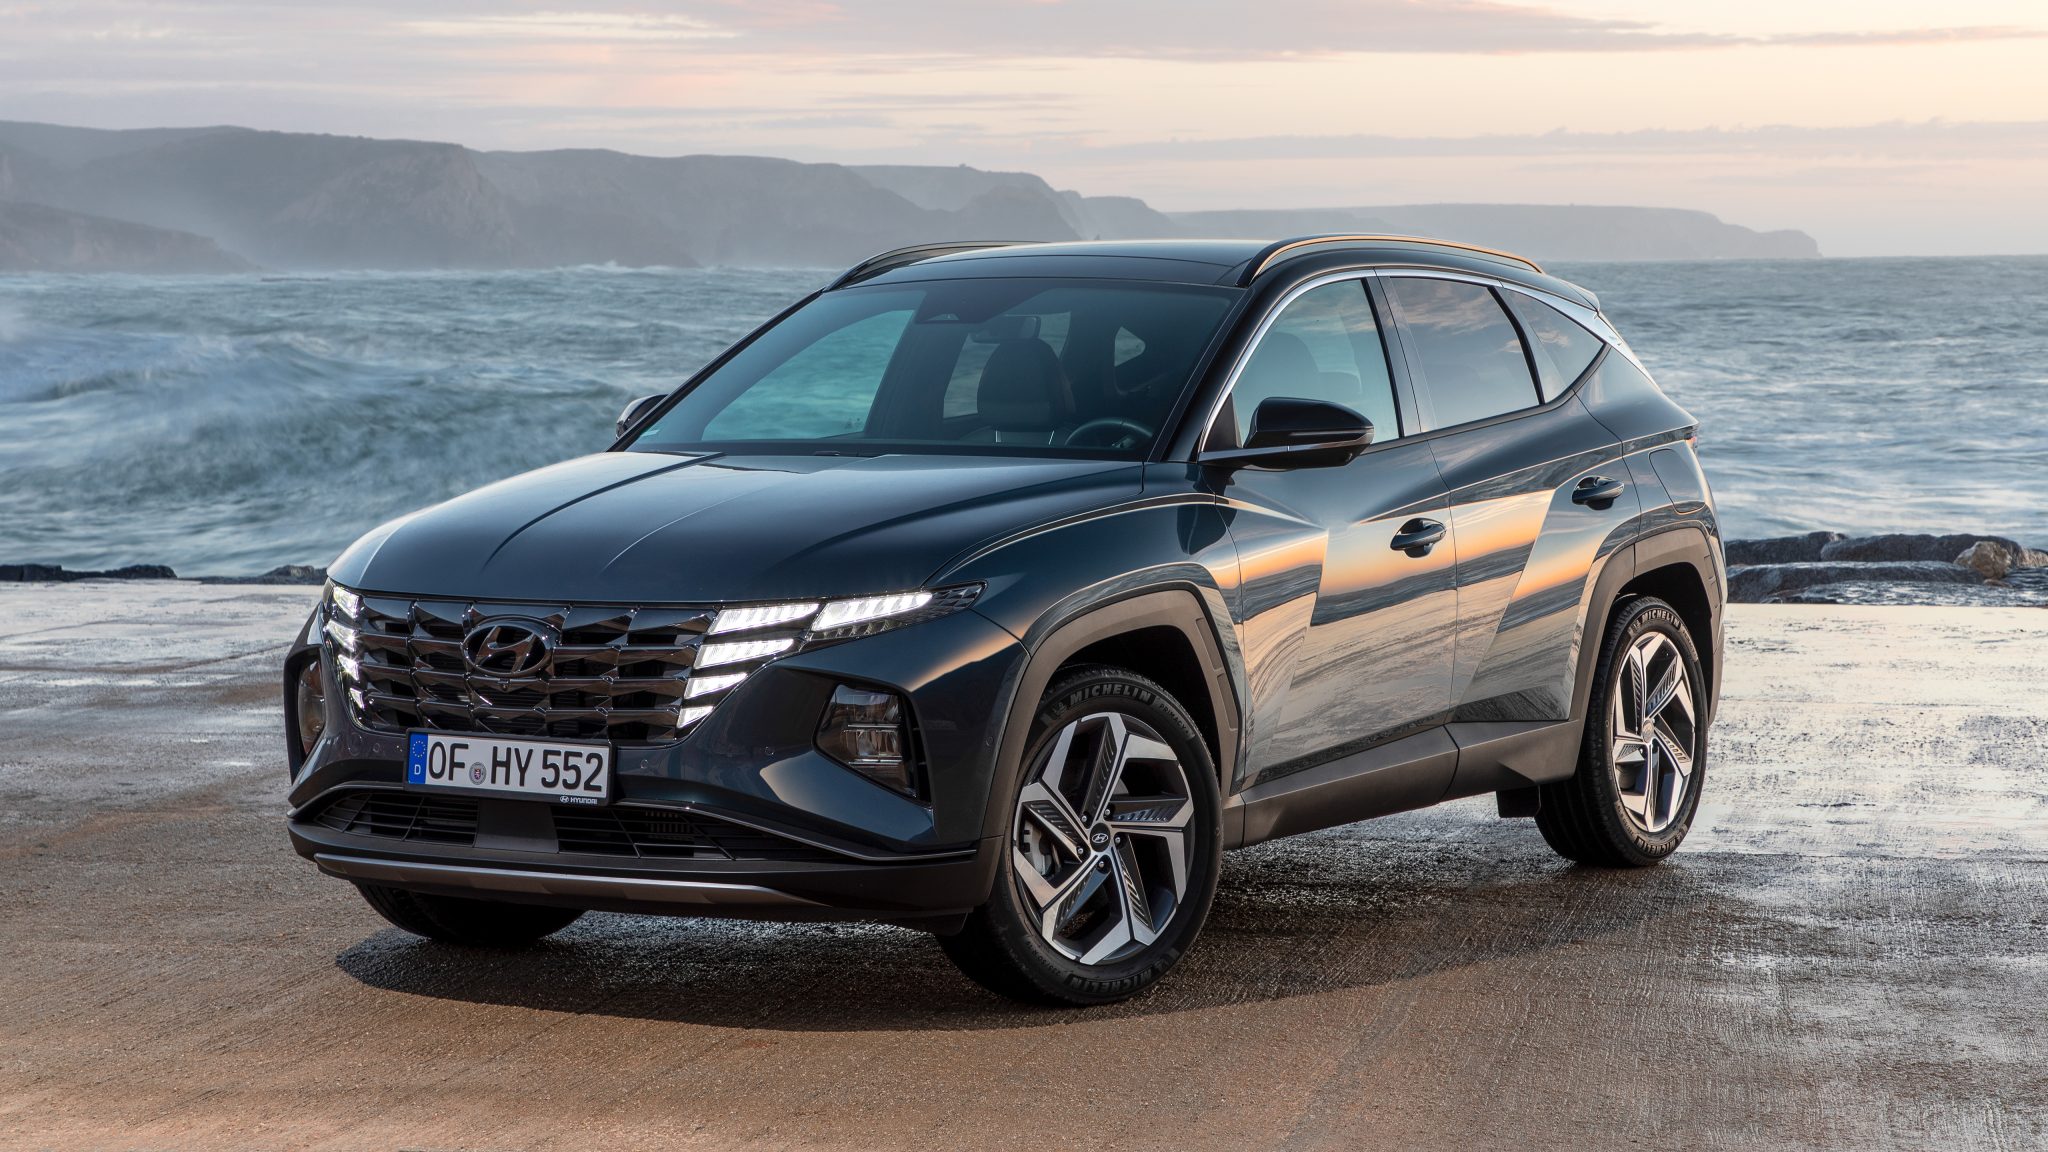
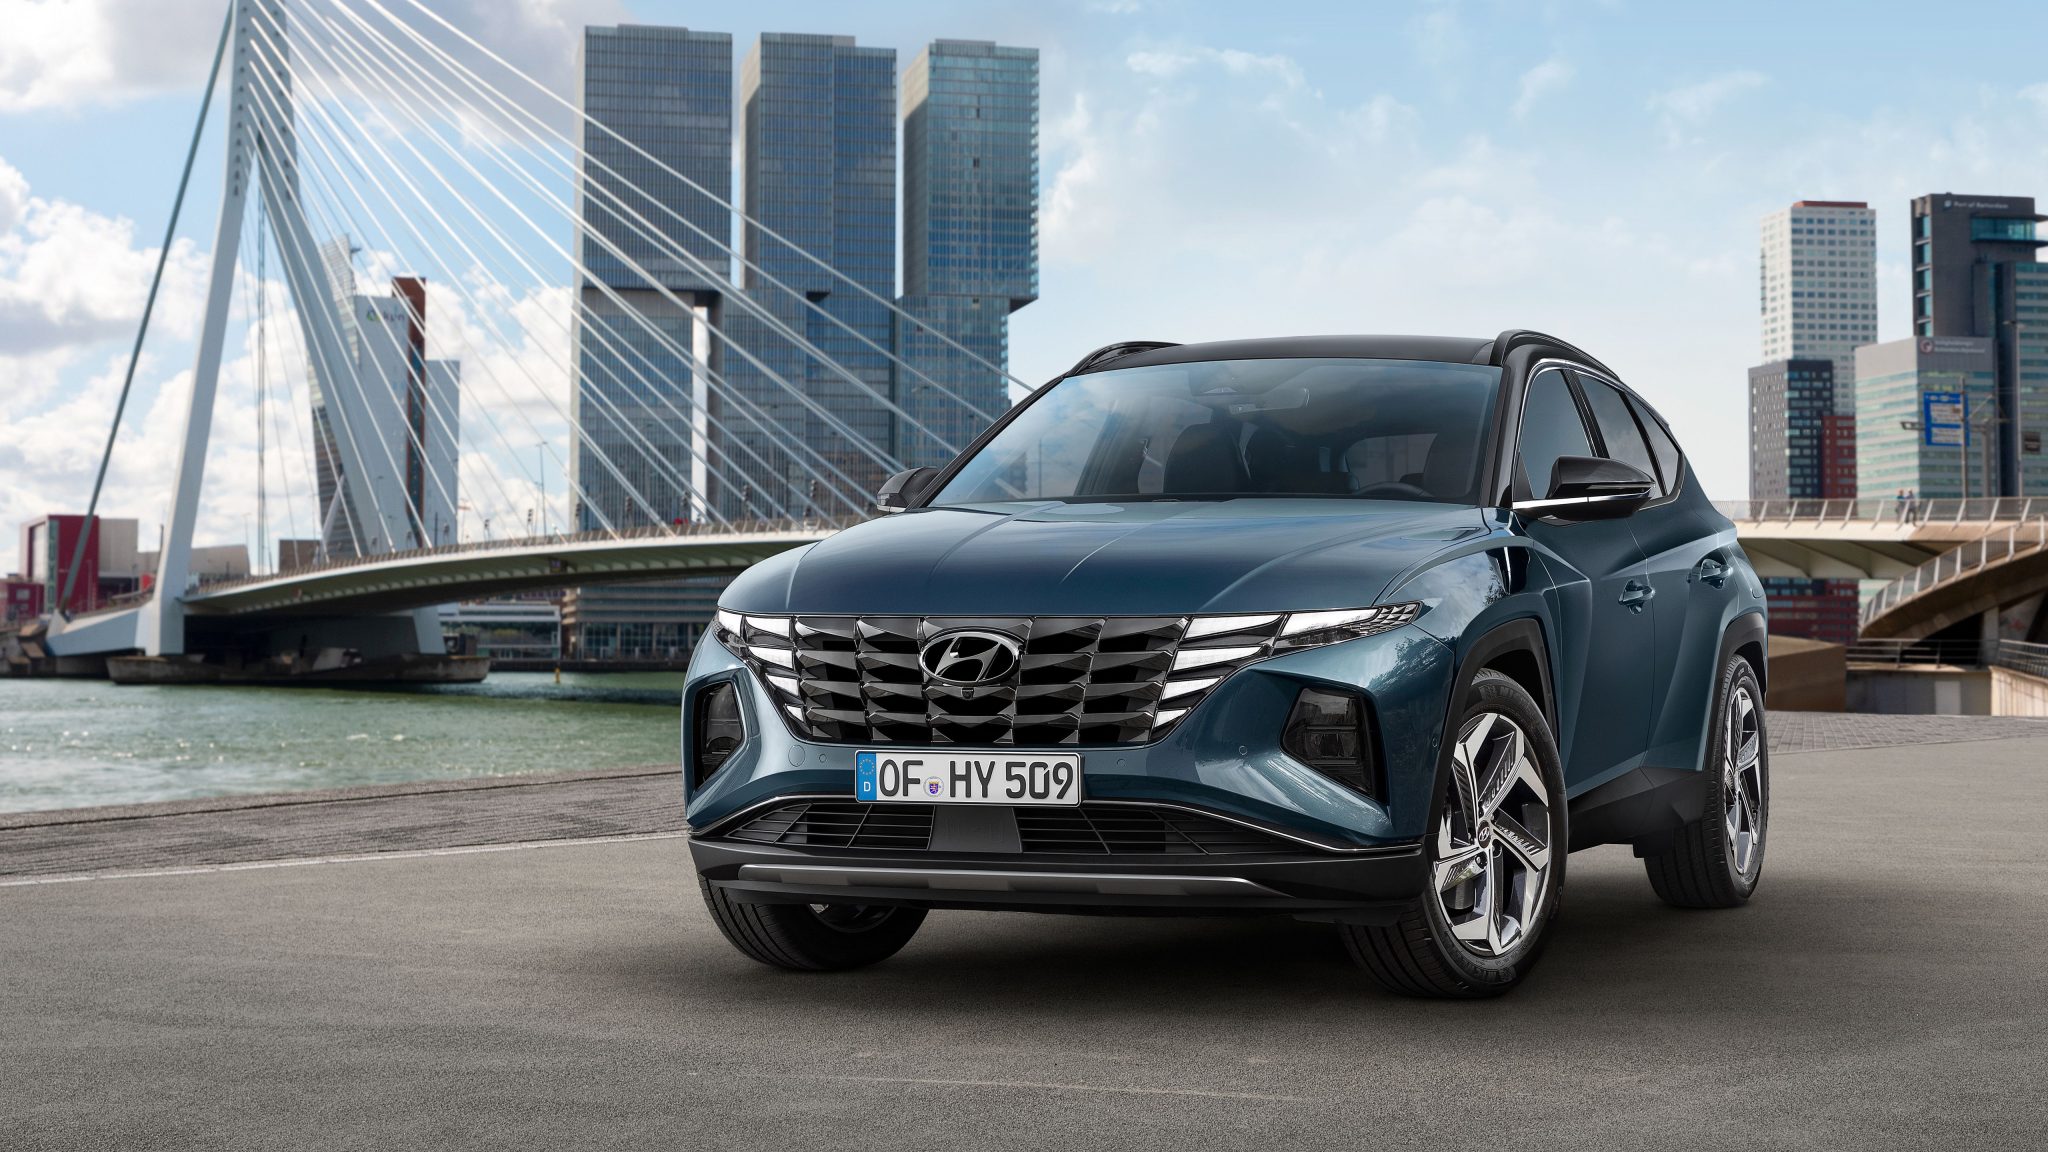
Hyundai Tucson
Starting at $27,250
The 2023 Tucson is available in six trim levels: SE, SEL, N Line, Limited, N Line Special Edition, and Ultimate. The SE is the base model and comes standard with features like a 8-inch touchscreen infotainment system, a 6-speaker sound system, and a rearview camera. The SEL adds features like a 10.25-inch digital instrument cluster, an 8-speaker Infinity sound system, and heated front seats. The N Line is the sporty-oriented model and comes standard with features like a sport-tuned suspension, a unique front fascia, and 19-inch alloy wheels. The Limited is the luxury-oriented model and comes standard with features like a leather-wrapped steering wheel, a panoramic sunroof, and a Bose sound system. The N Line Special Edition is a limited-production model that adds features like a unique black exterior, red accents, and 19-inch alloy wheels. The Ultimate is the top-of-the-line model and comes standard with features like a 10.25-inch touchscreen infotainment system, a 10-speaker Harman Kardon sound system, and a hands-free power liftgate.
The Tucson is available with two engine options: a 2.5L four-cylinder engine that produces 187 horsepower and 177 lb-ft of torque, or a 1.6L turbocharged four-cylinder engine that produces 227 horsepower and 258 lb-ft of torque. Both engines are mated to an eight-speed automatic transmission. The Tucson gets an EPA-estimated 25 mpg in the city and 32 mpg on the highway with the base engine, and 24 mpg in the city and 30 mpg on the highway with the turbocharged engine.
Hyundai Tucson Hybrid / Plug-In Hybrid
Starting at $32,325 / Plug-In Starting at $38,475
The Hyundai Tucson Hybrid and Plug-In Hybrid are both midsize SUVs that were first introduced in 2022. They are powered by a 1.6L turbocharged four-cylinder engine and an electric motor that produce a combined 227 horsepower and 195 lb-ft of torque. The hybrid system is mated to a six-speed automatic transmission. The Tucson Hybrid gets an EPA-estimated 39 mpg in the city and 36 mpg on the highway. The Tucson Plug-In Hybrid gets an EPA-estimated 36 mpg in the city and 30 mpg on the highway, and can travel up to 26 miles on electric power alone. Both the Tucson Hybrid and Plug-In Hybrid come standard with features like forward collision warning, automatic emergency braking, and lane departure warning. They are also available with a number of advanced safety features, such as blind spot monitoring and adaptive cruise control. The Tucson Plug-In Hybrid is more expensive than the Tucson Hybrid, but it offers the benefit of being able to run on electric power for short distances. If you live in an area with emissions restrictions or if you want to save money on fuel, the Tucson Plug-In Hybrid is a good option.
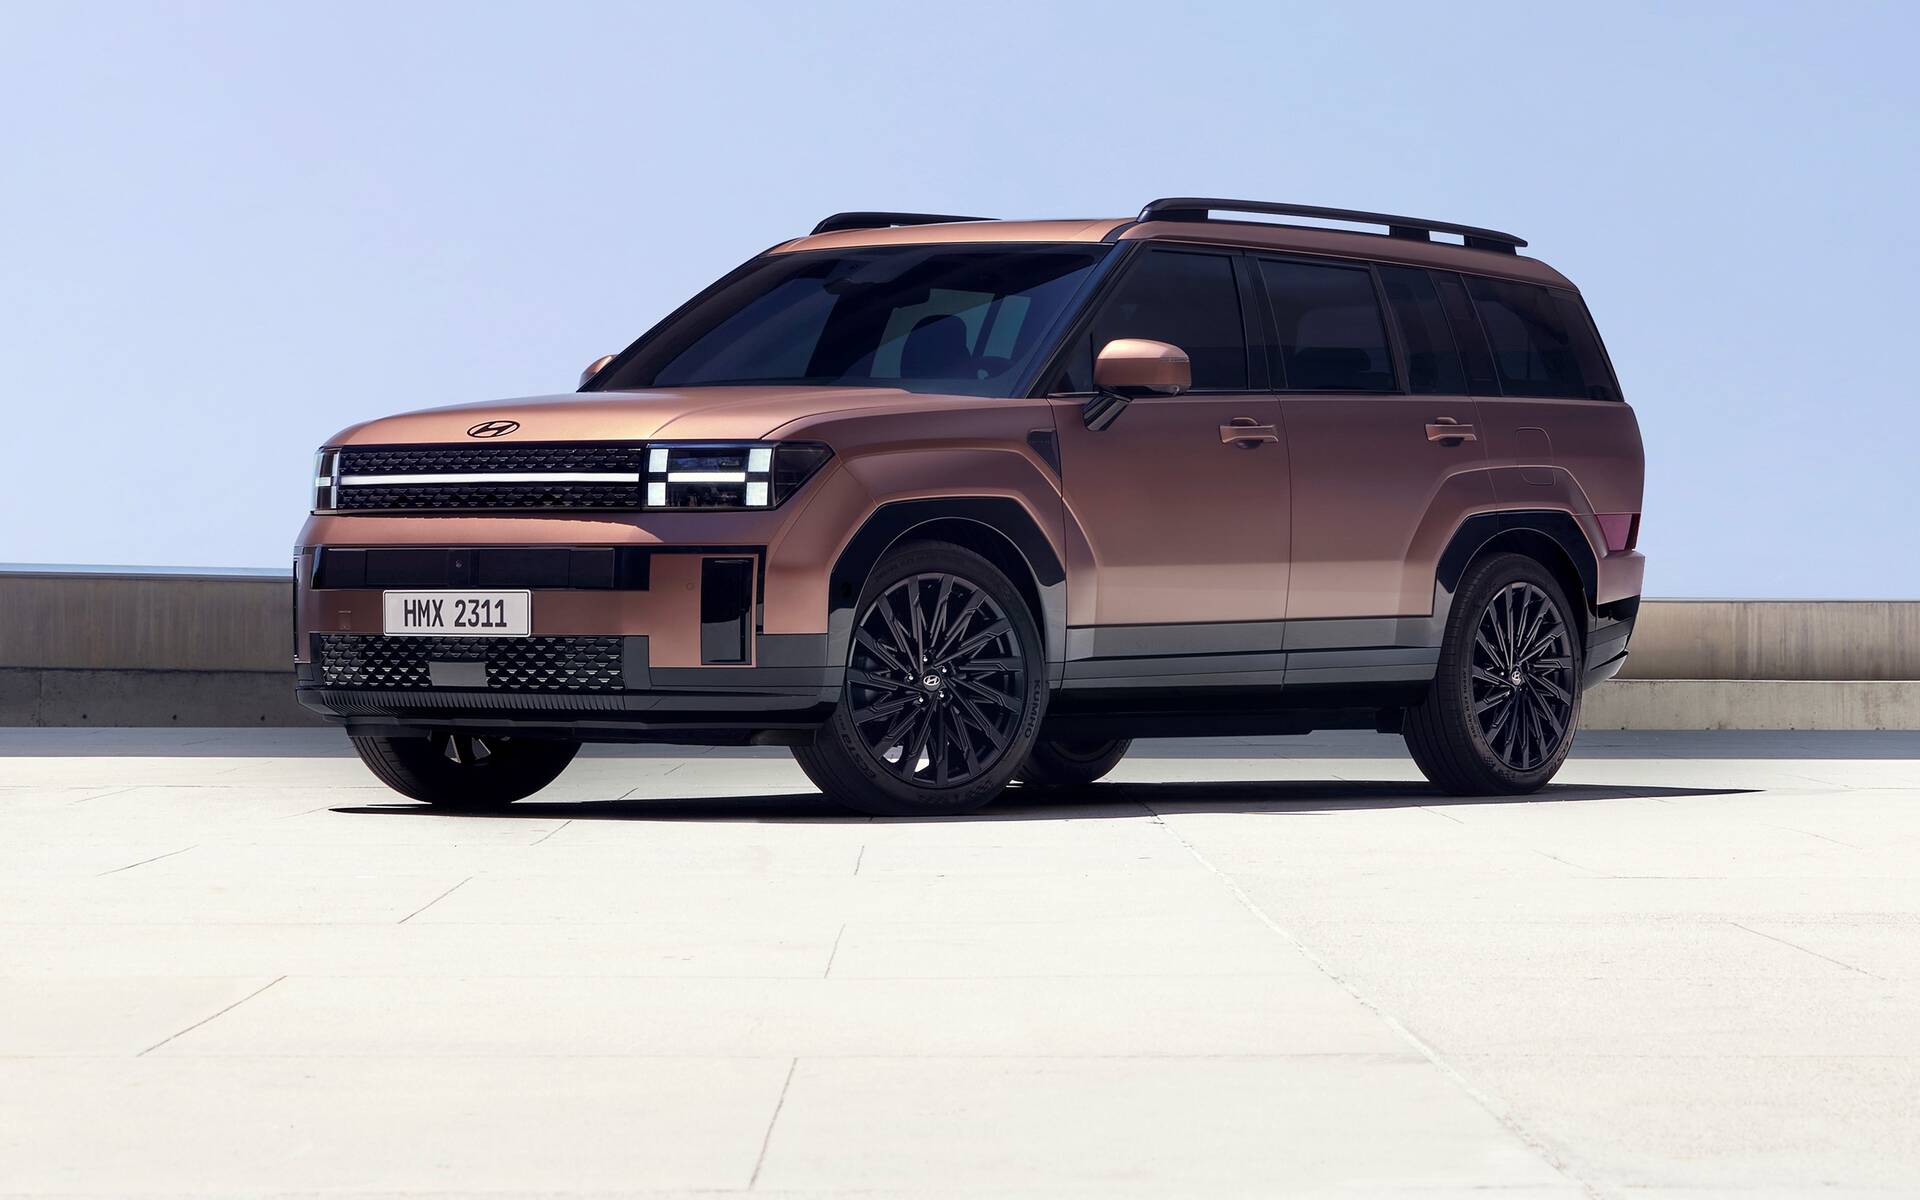
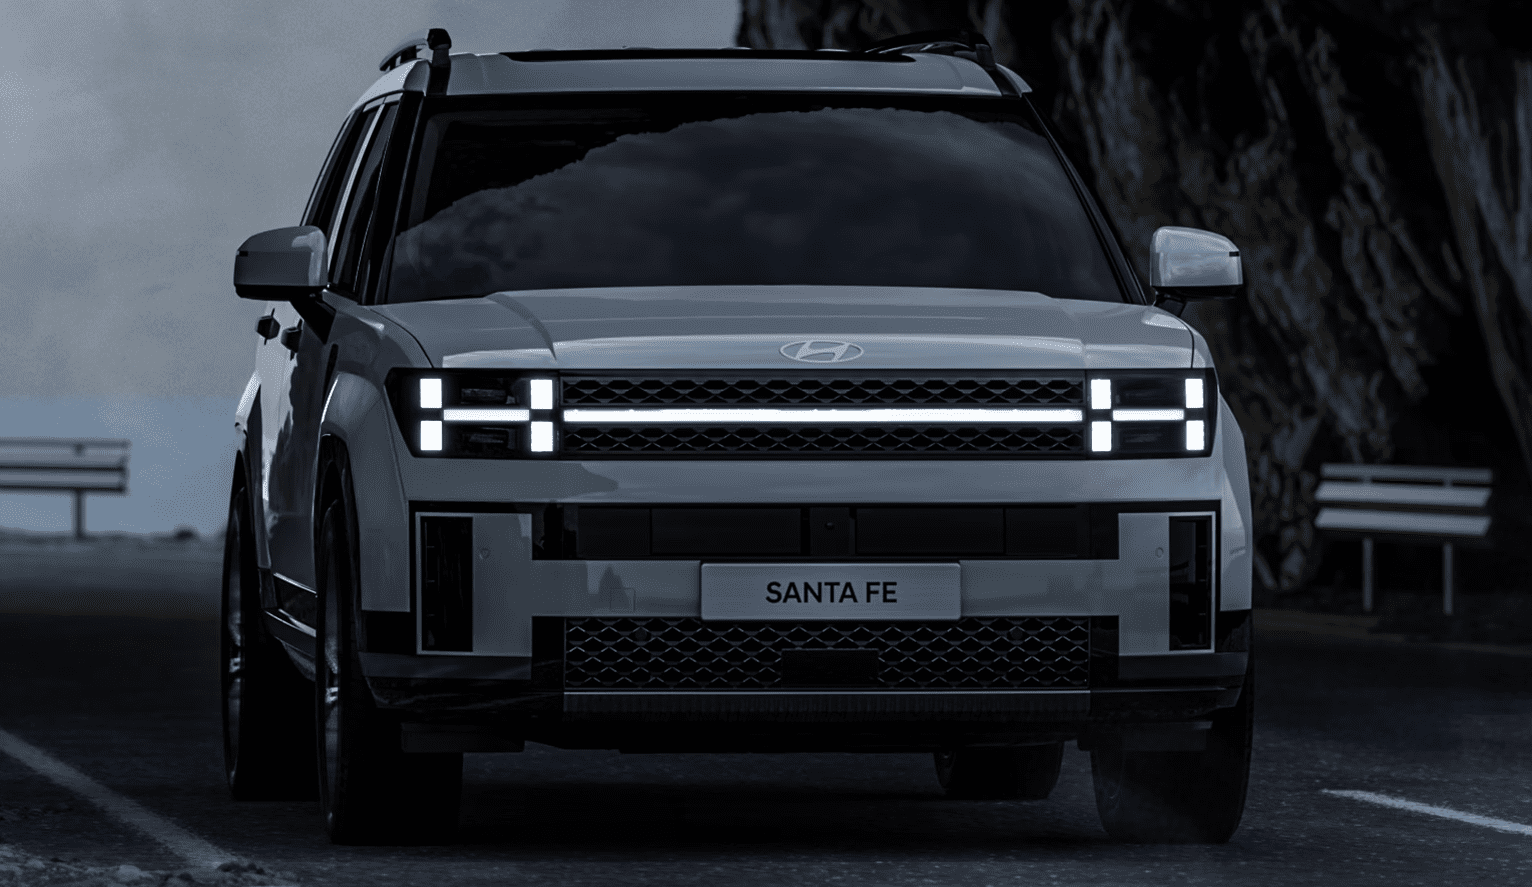
Hyundai Santa Fe (NEW ONE)
Starting at $28,750
The 2024 Santa Fe is available in six trim levels: SE, SEL, Limited, XRT, N Line, and Calligraphy. The SE is the base model and comes standard with features like a 8-inch touchscreen infotainment system, a 6-speaker sound system, and a rearview camera. The SEL adds features like a 10.25-inch digital instrument cluster, an 8-speaker Infinity sound system, and heated front seats. The Limited is the luxury-oriented model and comes standard with features like a leather-wrapped steering wheel, a panoramic sunroof, and a Bose sound system. The XRT is the rugged-oriented model and comes standard with features like black exterior accents, roof rails, and all-wheel drive. The N Line is the sporty-oriented model and comes standard with features like a sport-tuned suspension, a unique front fascia, and 19-inch alloy wheels. The Calligraphy is the top-of-the-line model and comes standard with features like a 10.25-inch touchscreen infotainment system, a 10-speaker Harman Kardon sound system, and a hands-free power liftgate.
The 2024 Santa Fe is available with three engine options: a 2.5L four-cylinder engine that produces 187 horsepower and 177 lb-ft of torque, a 1.6L turbocharged four-cylinder engine that produces 227 horsepower and 258 lb-ft of torque, or a 2.5L turbocharged four-cylinder engine that produces 300 horsepower and 311 lb-ft of torque. The 2.5L turbocharged engine is only available on the N Line and Calligraphy trims. All engines are mated to an eight-speed automatic transmission.
Hyundai Santa Fe Hybrid / Plug-In Hybrid
Starting at $36,210 / Plug-In Starting at $42,410
The Hyundai Santa Fe Hybrid and Plug-In Hybrid are both midsize SUVs that were introduced in 2023. They are powered by a 1.6L turbocharged four-cylinder engine and an electric motor that produce a combined 227 horsepower and 195 lb-ft of torque. The hybrid system is mated to a six-speed automatic transmission. The main difference between the two models is the all-electric range of the Plug-In Hybrid. The Santa Fe Hybrid gets an EPA-estimated 39 mpg in the city and 36 mpg on the highway, while the Santa Fe Plug-In Hybrid gets an EPA-estimated 36 mpg in the city and 30 mpg on the highway, and can travel up to 30 miles on electric power alone.
The Santa Fe Hybrid also has a smaller battery pack than the Santa Fe Plug-In Hybrid. The Santa Fe Hybrid’s battery pack has a capacity of 1.57 kWh, while the Santa Fe Plug-In Hybrid’s battery pack has a capacity of 13.8 kWh. The Santa Fe Hybrid is also slightly less expensive than the Santa Fe Plug-In Hybrid. The starting MSRP for the Santa Fe Hybrid is $29,550, while the starting MSRP for the Santa Fe Plug-In Hybrid is $34,550.
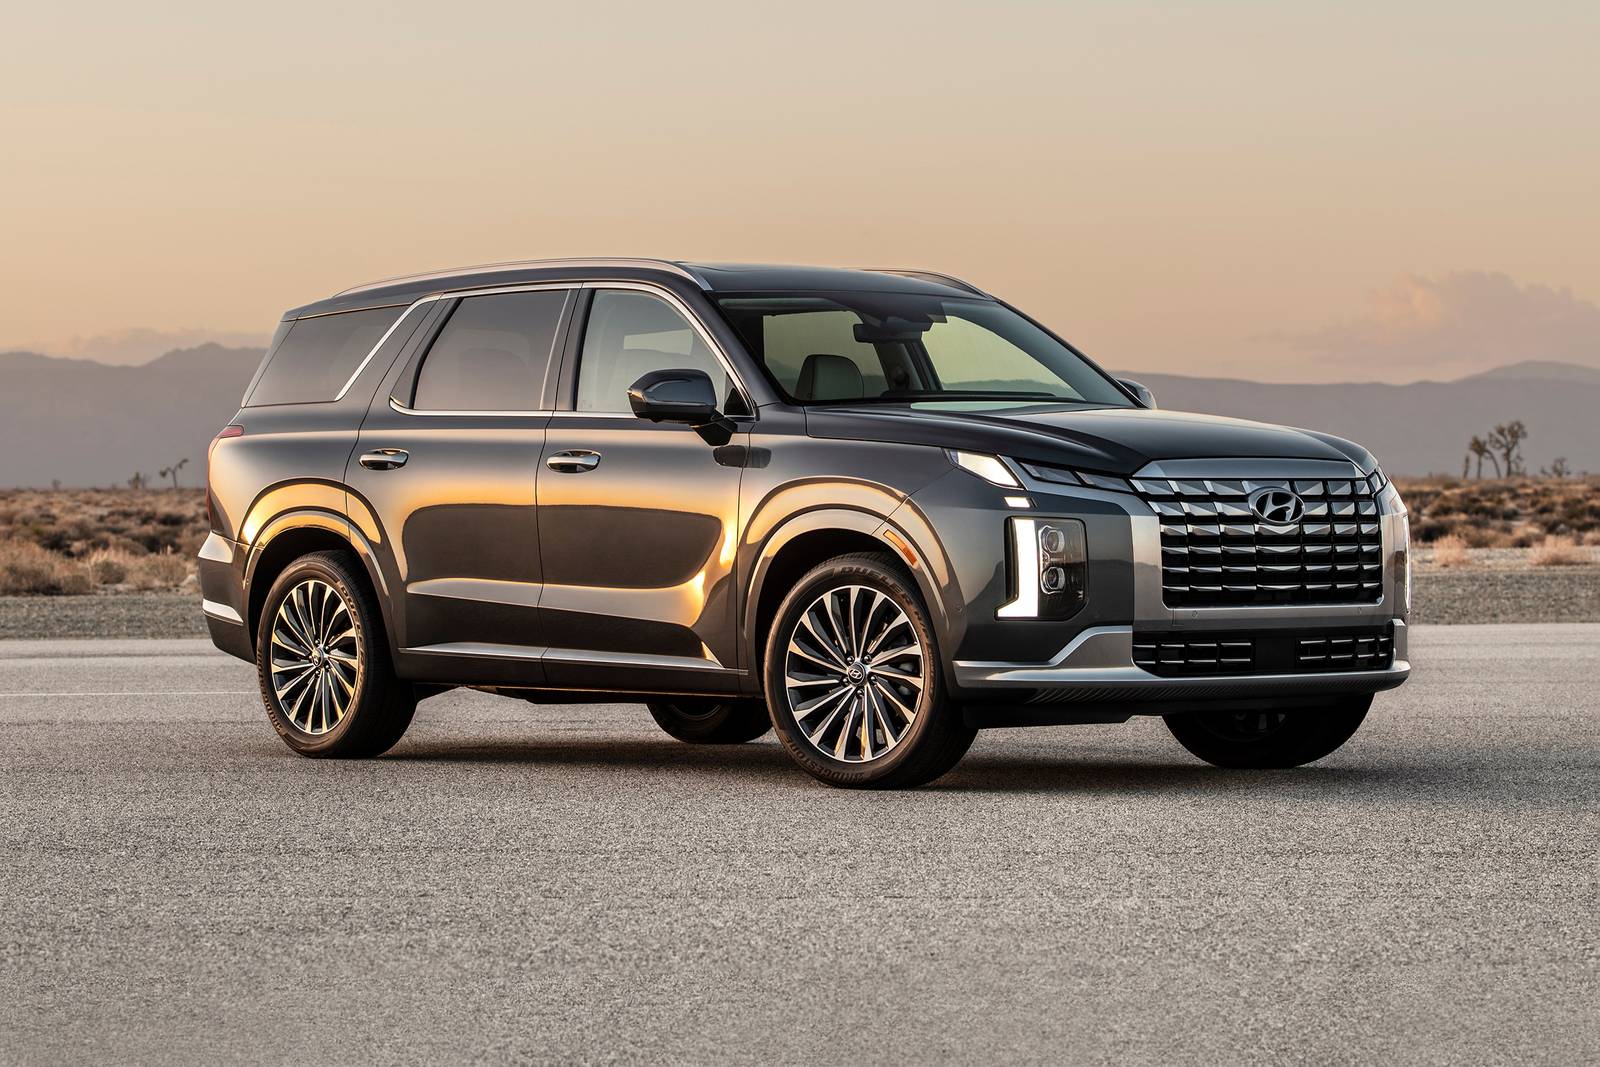
Hyundai Palisade
Starting at $36,400
The 2023 Palisade is available in four trim levels: SE, SEL, Limited, and Calligraphy. The SE is the base model and comes standard with features like a 8-inch touchscreen infotainment system, a 6-speaker sound system, and a rearview camera. The SEL adds features like a 10.25-inch digital instrument cluster, an 8-speaker Infinity sound system, and heated front seats. The Limited is the luxury-oriented model and comes standard with features like a leather-wrapped steering wheel, a panoramic sunroof, and a Bose sound system. The Calligraphy is the top-of-the-line model and comes standard with features like a 10.25-inch touchscreen infotainment system, a 10-speaker Harman Kardon sound system, and a hands-free power liftgate. The Palisade is available with one engine option: a 3.8L V6 engine that produces 291 horsepower and 262 lb-ft of torque. It is mated to an eight-speed automatic transmission. The Palisade gets an EPA-estimated 19 mpg in the city and 26 mpg on the highway.
Hyundai Ioniq 5
Starting at $41,450
The Hyundai Ioniq 5 is an electric SUV that was first introduced in 2022. It is known for its futuristic design, long range, and fast charging capabilities. The Ioniq 5 is a good choice for those who are looking for an electric SUV with a long range and fast charging capabilities. It is also a good choice for those who are looking for a vehicle with a futuristic design.
The Ioniq 5 is available in two battery sizes: a 58.2-kWh battery pack that provides an EPA-estimated 220 miles of range, and a 77.4-kWh battery pack that provides an EPA-estimated 303 miles of range. The Ioniq 5 can be charged from 10% to 80% in 18 minutes using a 350-kW DC fast charger. The Ioniq 5 is available in rear-wheel drive or all-wheel drive configurations. The rear-wheel drive model produces 225 horsepower and 258 pound-feet of torque, while the all-wheel drive model produces 302 horsepower and 446 pound-feet of torque. The Ioniq 5 comes standard with features like a 12.3-inch digital instrument cluster, a 12.3-inch touchscreen infotainment system, and a wireless charging pad. It is also available with a number of advanced safety features, such as blind spot monitoring and adaptive cruise control.
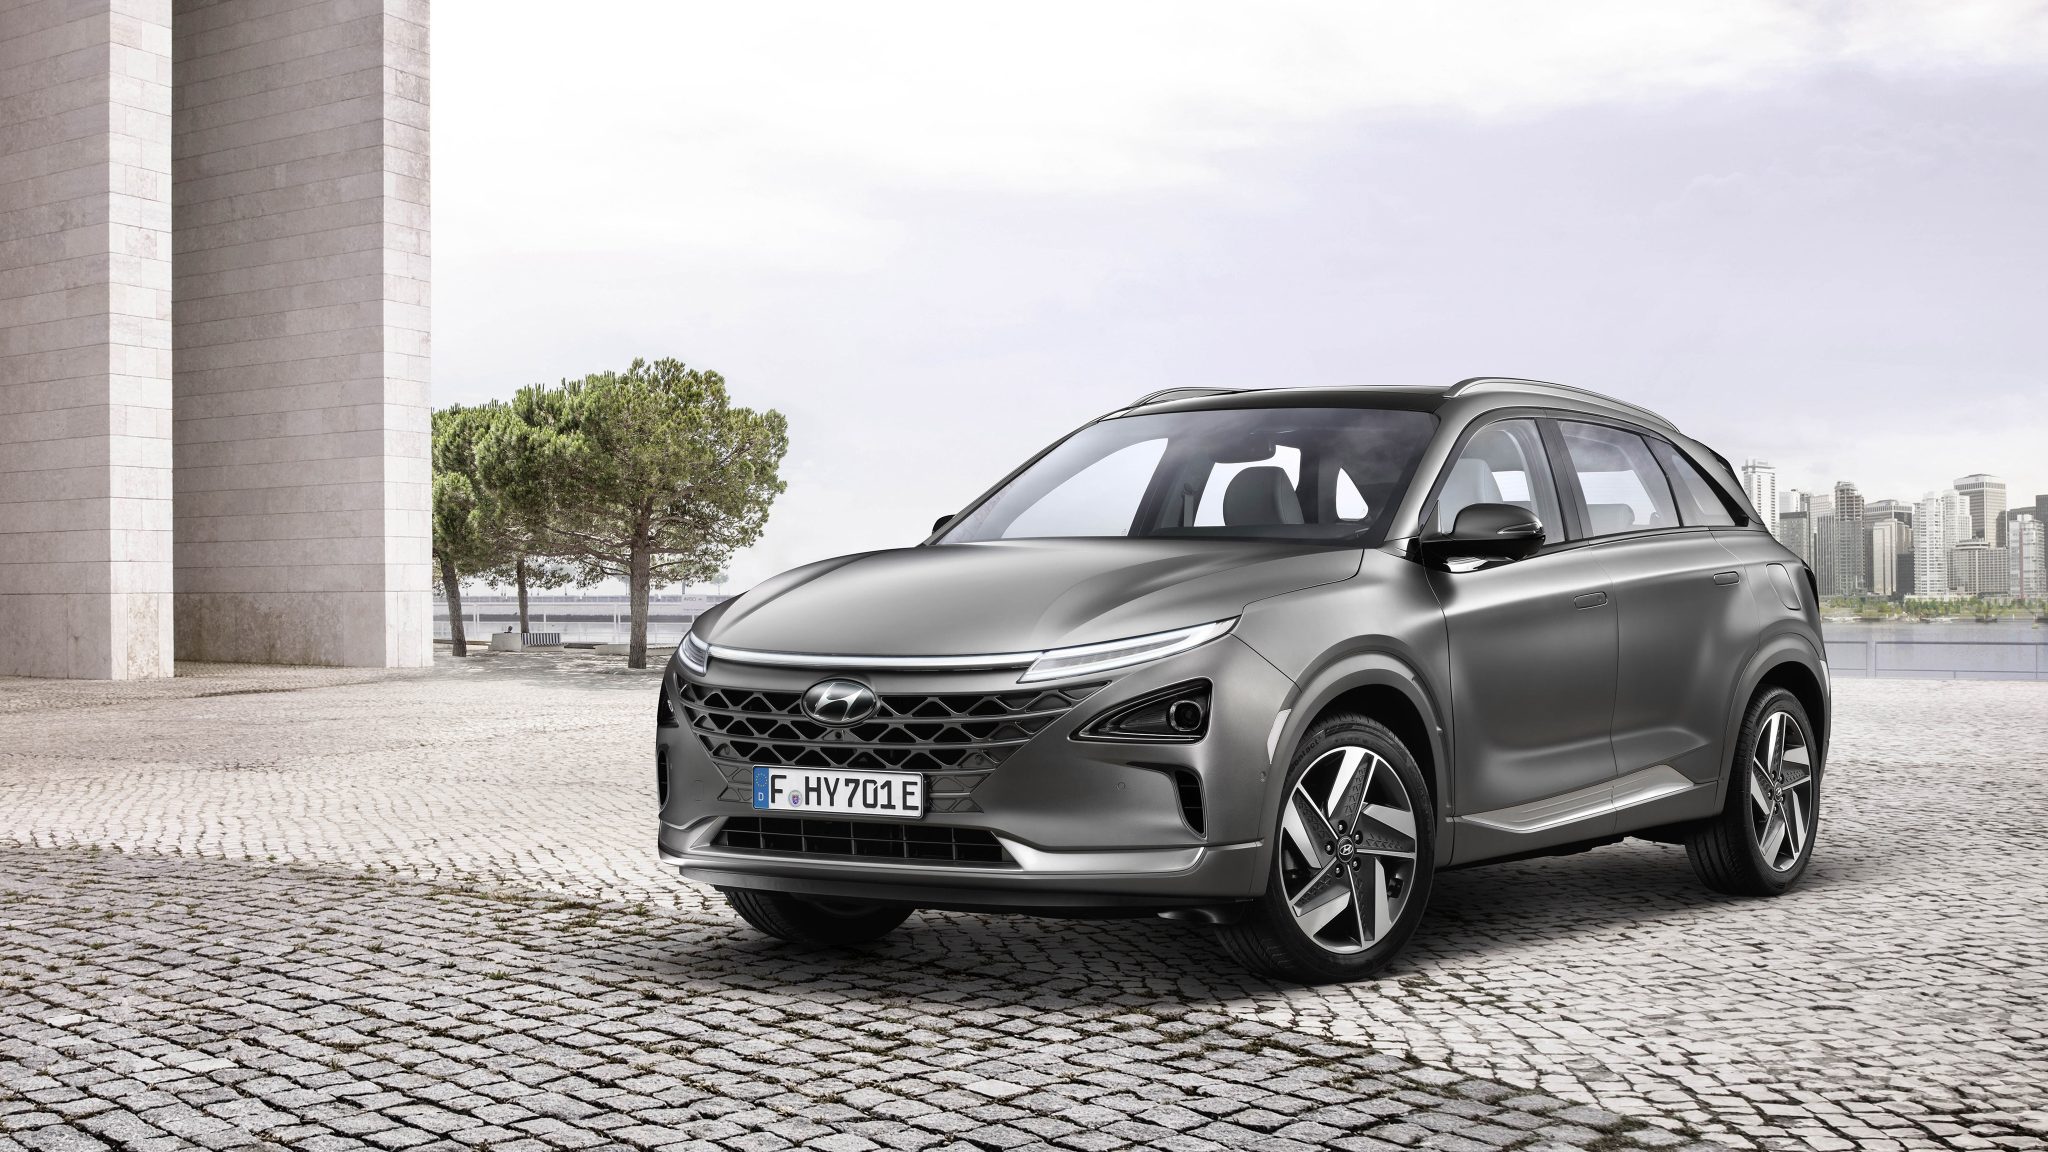
Hyundai Nexo
Starting at $60,135
The Hyundai Nexo is a fuel cell electric vehicle (FCEV) that was first introduced in 2018. It is known for its long range, quiet operation, and zero-emissions. The Nexo is powered by a hydrogen fuel cell that produces electricity to power the electric motor. The Nexo has a range of up to 413 miles on a single tank of hydrogen. The Nexo can be refueled in about 5 minutes. The Nexo is available in rear-wheel drive or all-wheel drive configurations. The rear-wheel drive model produces 126 horsepower and 291 pound-feet of torque, while the all-wheel drive model produces 161 horsepower and 395 pound-feet of torque. The Nexo comes standard with features like a 12.3-inch digital instrument cluster, a 10.25-inch touchscreen infotainment system, and a wireless charging pad. It is also available with a number of advanced safety features, such as blind spot monitoring and adaptive cruise control.
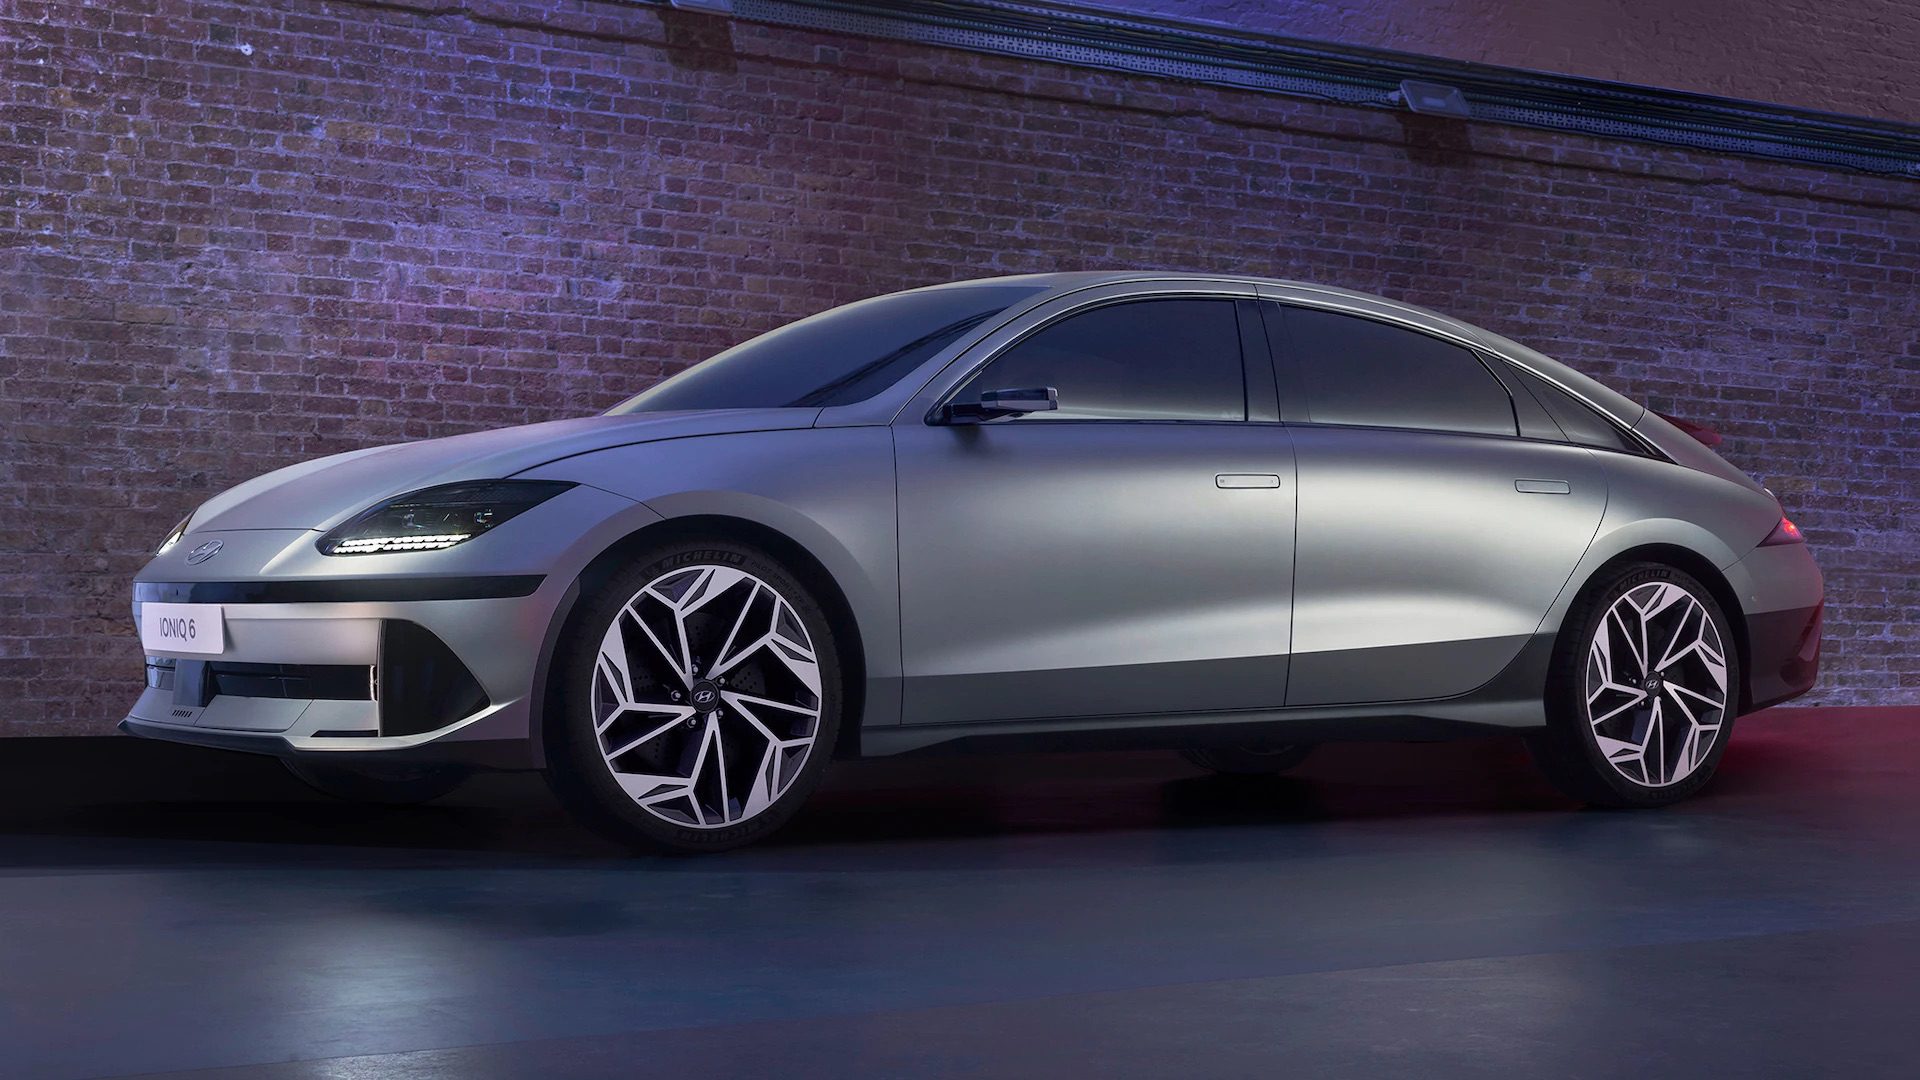
Hyundai Ioniq 6
Starting at $41,600
The Hyundai Ioniq 6 is an electric sedan that was first introduced in 2022. It is based on the same platform as the Hyundai Ioniq 5, but it has a more streamlined design. The Ioniq 6 is available with a single rear-wheel drive motor or a dual-motor all-wheel drive system. The single-motor model produces 225 horsepower and 258 pound-feet of torque, while the dual-motor model produces 313 horsepower and 446 pound-feet of torque. The Ioniq 6 has a range of up to 369 miles on a single charge.
The Ioniq 6 comes standard with features like a 12.3-inch digital instrument cluster, a 12.3-inch touchscreen infotainment system, and a wireless charging pad. It is also available with a number of advanced safety features, such as blind spot monitoring and adaptive cruise control. The Ioniq 6 is a good choice for those who are looking for an electric sedan with a long range and a sleek design. It is also a good choice for those who are looking for a vehicle with a quiet operation.
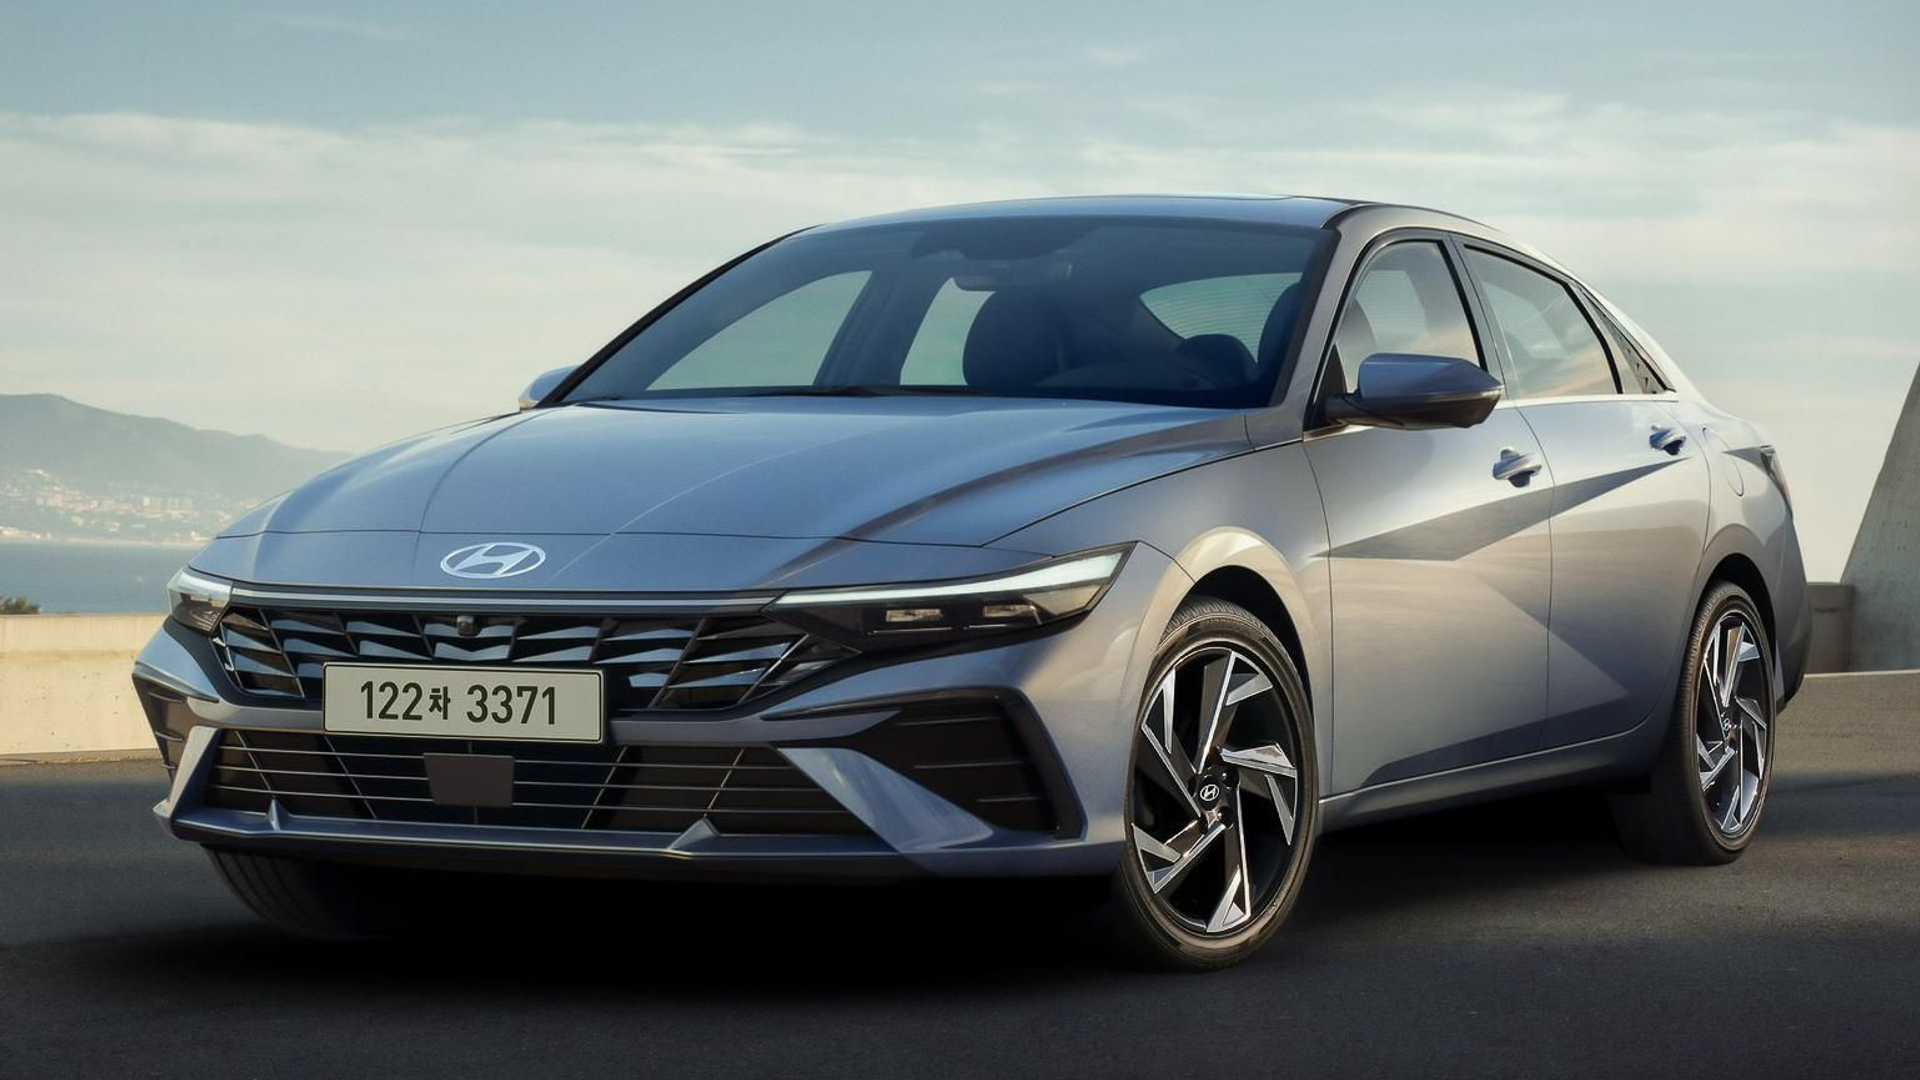
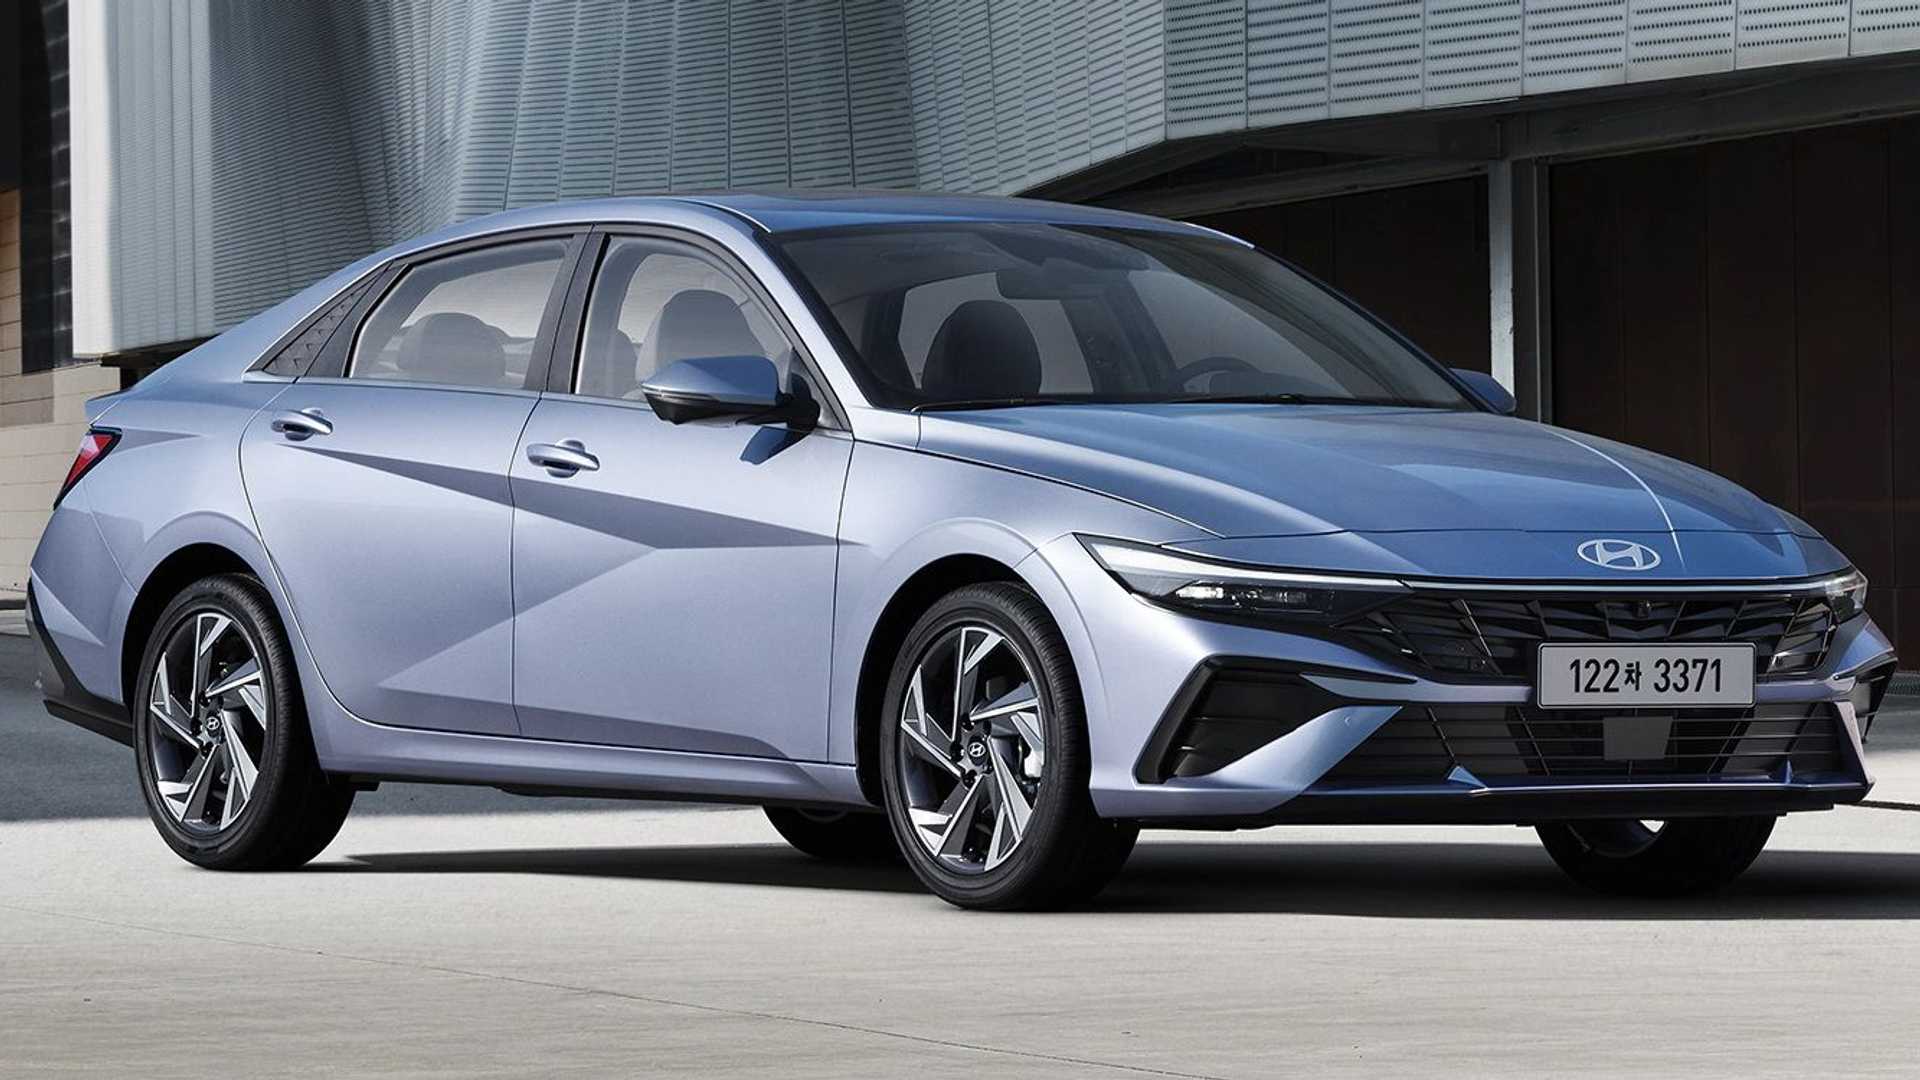
Hyundai Elantra
Starting at $20,950
The 2024 Elantra is available in five trim levels: SE, SEL, Limited, N Line, and N Line Special Edition. The SE is the base model and comes standard with features like a 8-inch touchscreen infotainment system, a 6-speaker sound system, and a rearview camera. The SEL adds features like a 10.25-inch digital instrument cluster, an 8-speaker Infinity sound system, and heated front seats. The Limited is the luxury-oriented model and comes standard with features like a leather-wrapped steering wheel, a panoramic sunroof, and a Bose sound system. The N Line is the sporty-oriented model and comes standard with features like a sport-tuned suspension, a unique front fascia, and 19-inch alloy wheels. The N Line Special Edition is a limited-production model that adds features like a unique black exterior, red accents, and 19-inch alloy wheels.
The 2024 Elantra is available with two engine options: a 2.0L four-cylinder engine that produces 147 horsepower and 132 lb-ft of torque, or a 1.6L turbocharged four-cylinder engine that produces 201 horsepower and 195 lb-ft of torque. Both engines are mated to an eight-speed automatic transmission.
Hyundai Elantra Hybrid
Starting at $24,550
The 2023 Hyundai Elantra Hybrid is a hybrid compact sedan that was first introduced in 2022. It is powered by a 1.6L four-cylinder engine and an electric motor that produce a combined 139 horsepower and 195 lb-ft of torque. The hybrid system is mated to a six-speed automatic transmission. The Elantra Hybrid gets an EPA-estimated 50 mpg in the city and 47 mpg on the highway. It is also available with all-wheel drive, which reduces the fuel economy to 48 mpg in the city and 45 mpg on the highway.
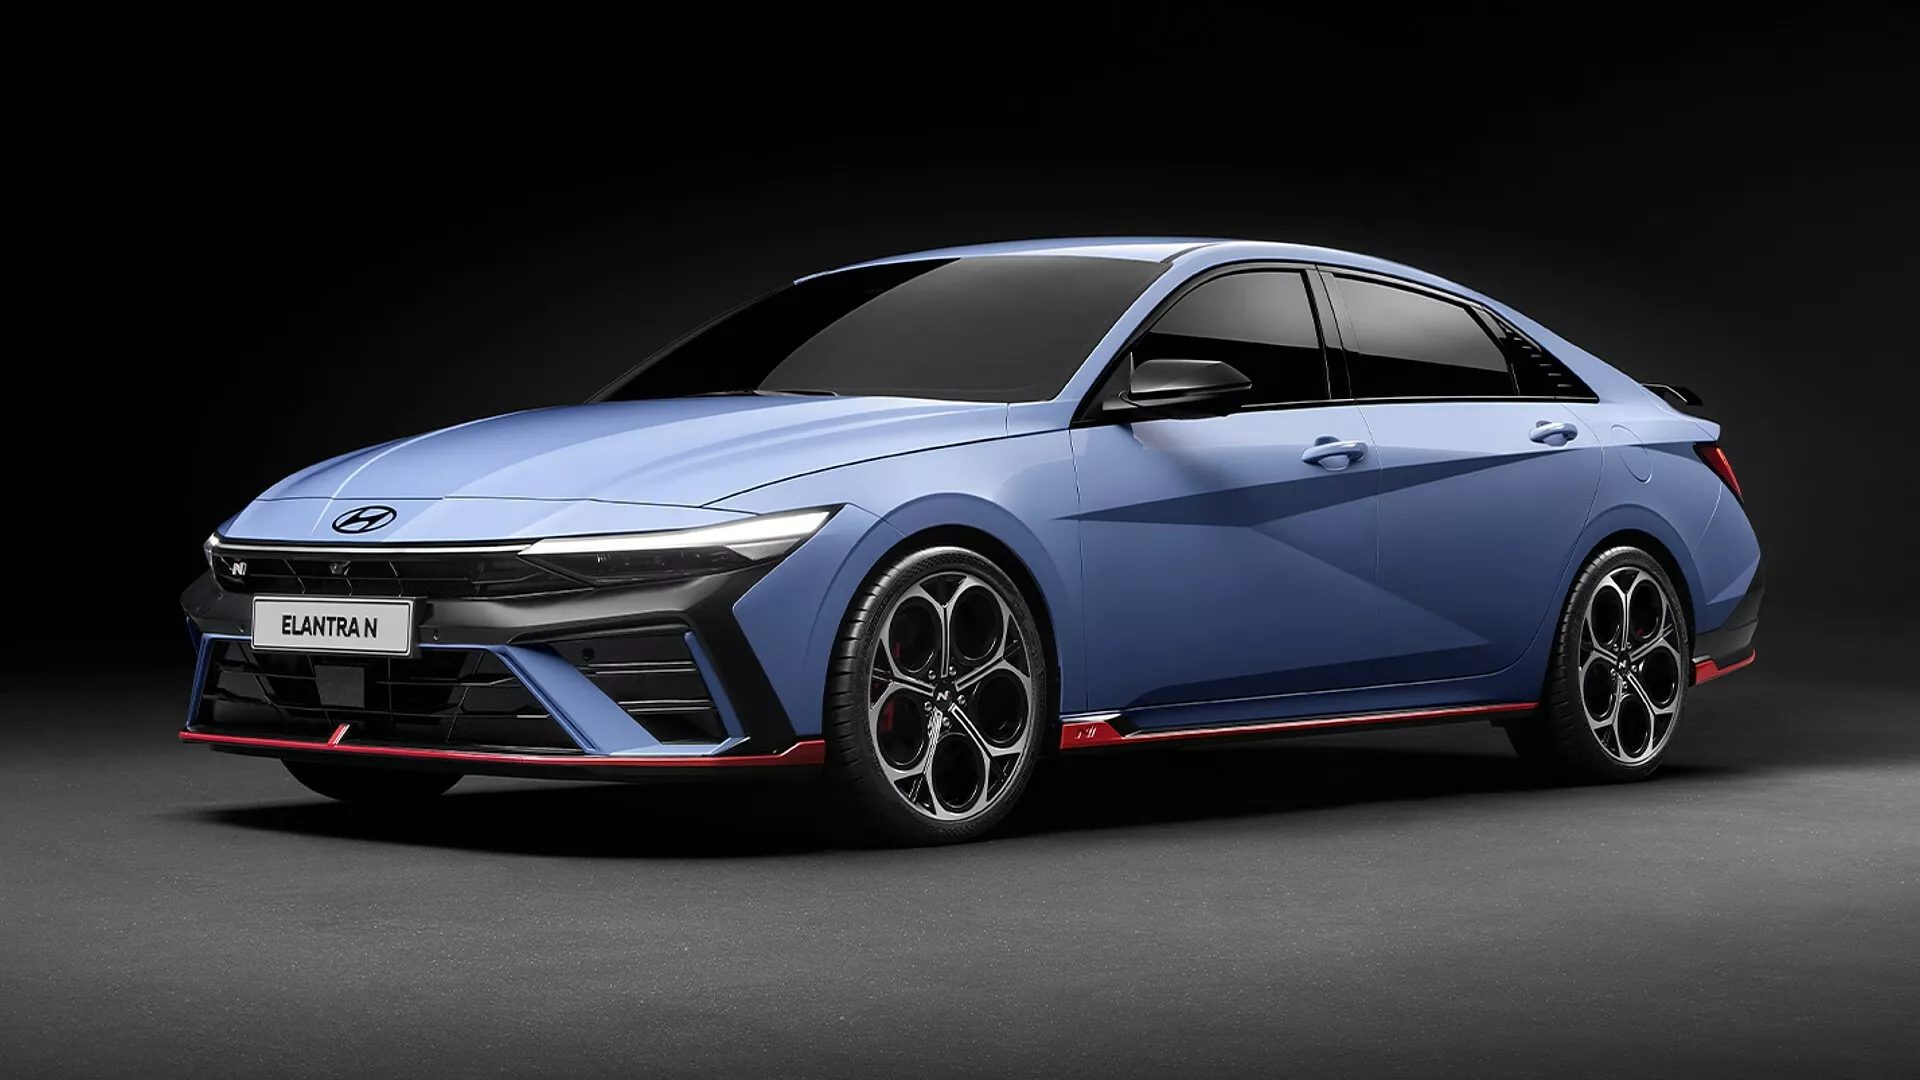
Hyundai Elantra N
Starting at $32,900
The 2023 Hyundai Elantra N is a performance compact sedan that was first introduced in 2022. It is powered by a 2.0L turbocharged four-cylinder engine that produces 276 horsepower and 289 lb-ft of torque. The engine is mated to an eight-speed wet dual-clutch transmission. The Elantra N is expected to be a popular choice among consumers and critics alike. It has been praised for its powerful engine, sporty handling, and long list of standard features. The Elantra N is expected to be a strong seller for Hyundai in the years to come. The Elantra N is the first N model from Hyundai to be available in the United States. It is part of Hyundai’s N performance sub-brand, which is dedicated to developing high-performance vehicles.
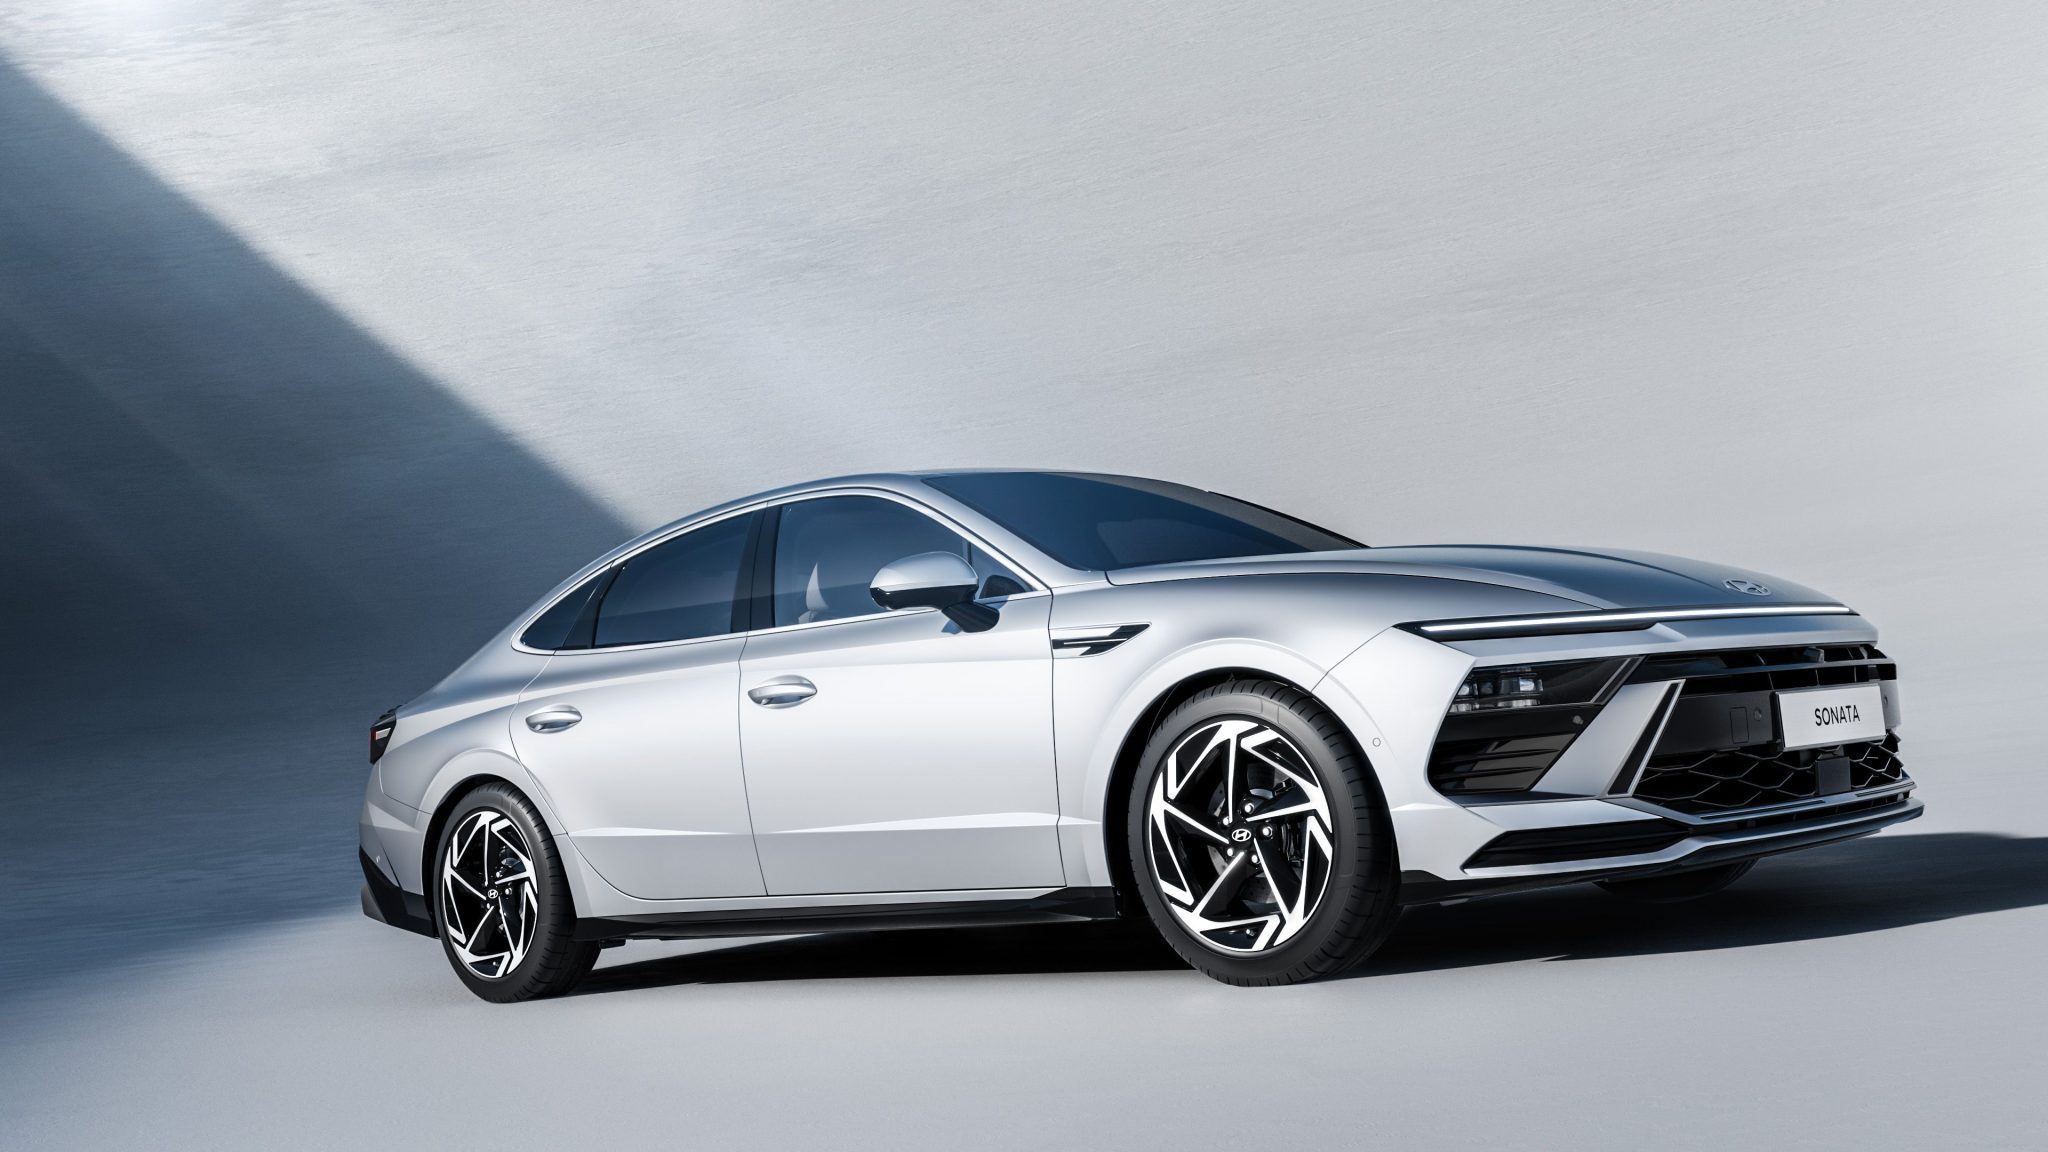
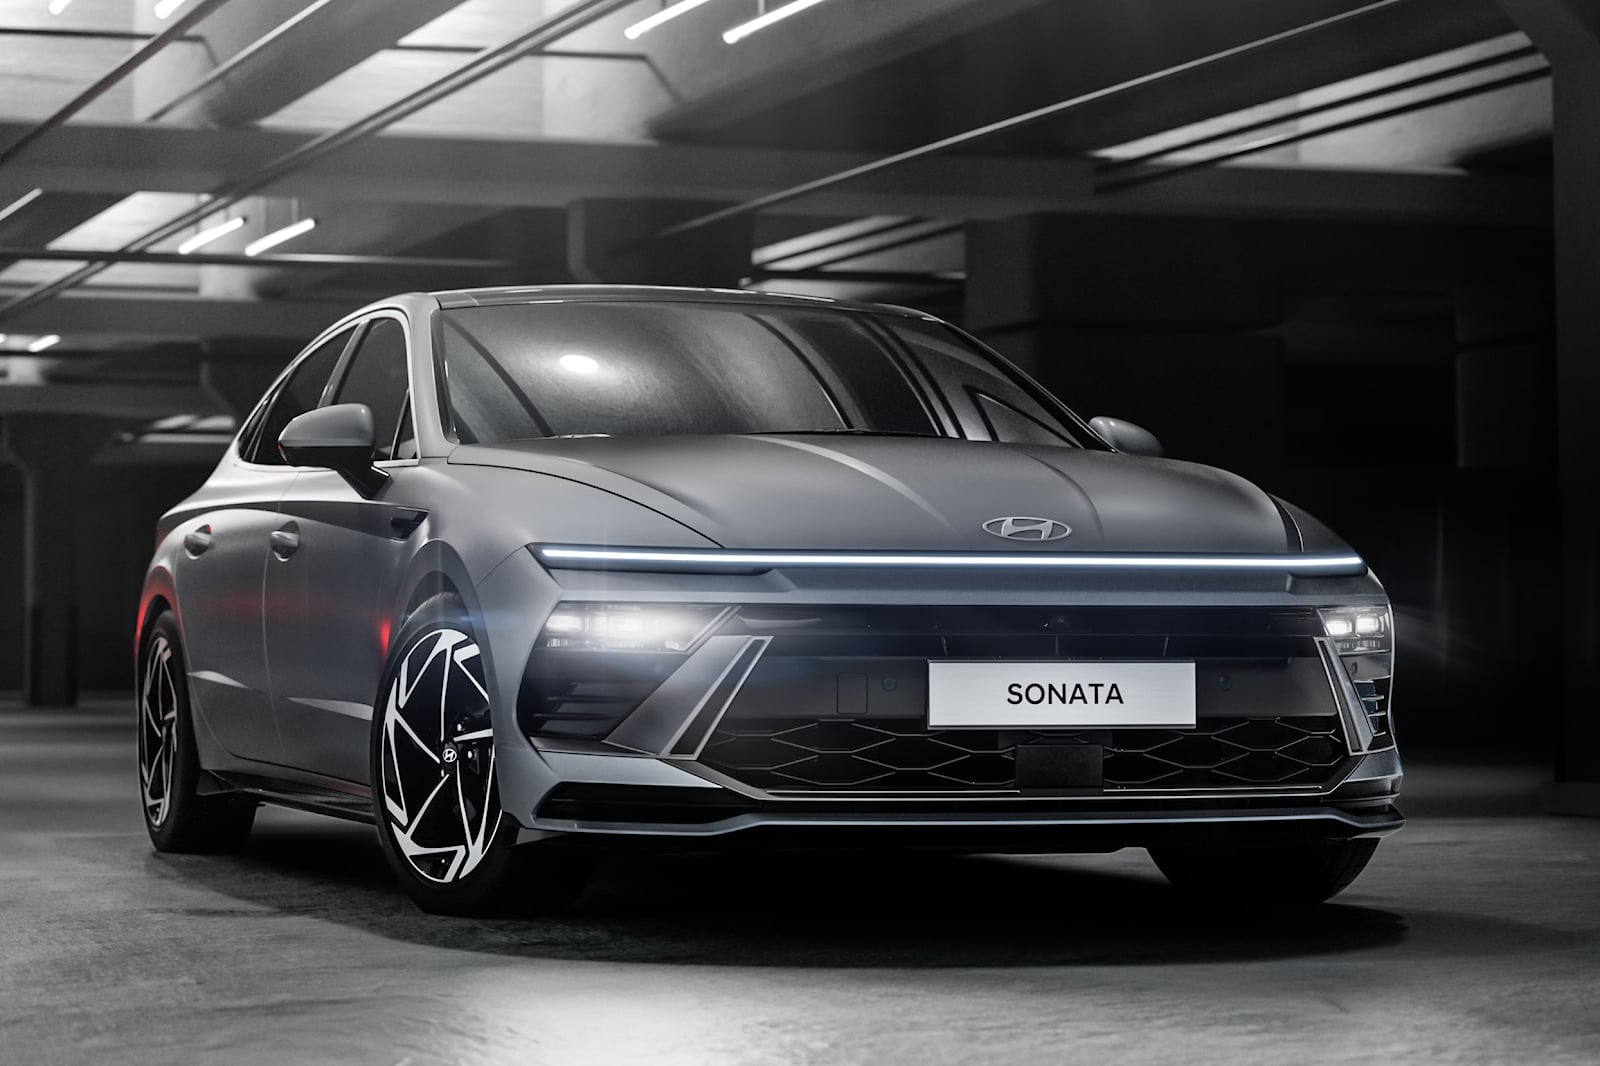
Hyundai Sonata
Starting at $24,450
The 2024 Hyundai Sonata is a midsize sedan that is all-new for the 2024 model year. It has a more modern and stylish design than the previous generation, and it is available with a variety of powertrain options, including hybrid and plug-in hybrid. The 2024 Sonata is available in six trim levels: SE, SEL, Limited, N Line, N Line Special Edition, and Hybrid. The SE is the base model and comes standard with features like a 8-inch touchscreen infotainment system, a 6-speaker sound system, and a rearview camera. The SEL adds features like a 10.25-inch digital instrument cluster, an 8-speaker Infinity sound system, and heated front seats. The Limited is the luxury-oriented model and comes standard with features like a leather-wrapped steering wheel, a panoramic sunroof, and a Bose sound system. The N Line is the sporty-oriented model and comes standard with features like a sport-tuned suspension, a unique front fascia, and 19-inch alloy wheels. The N Line Special Edition is a limited-production model that adds features like a unique black exterior, red accents, and 19-inch alloy wheels.
Hyundai Sonata Hybrid
Starting at $28,450
he Hybrid is powered by a 1.6L turbocharged four-cylinder engine and an electric motor that produce a combined 193 horsepower and 195 lb-ft of torque. The hybrid system is mated to a six-speed automatic transmission. The Hybrid gets an EPA-estimated 50 mpg in the city and 45 mpg on the highway. The Plug-in Hybrid is powered by a 1.6L turbocharged four-cylinder engine and an electric motor that produce a combined 202 horsepower and 195 lb-ft of torque. The plug-in hybrid system is mated to a six-speed automatic transmission and a 13.8kWh battery pack. The Plug-in Hybrid gets an EPA-estimated 39 miles in electric mode and 40 mpg in hybrid mode.
Sources: Manufacturers, ANDC, JATO Dynamics.


