
Hyundai Palisade Sales Data & Trends
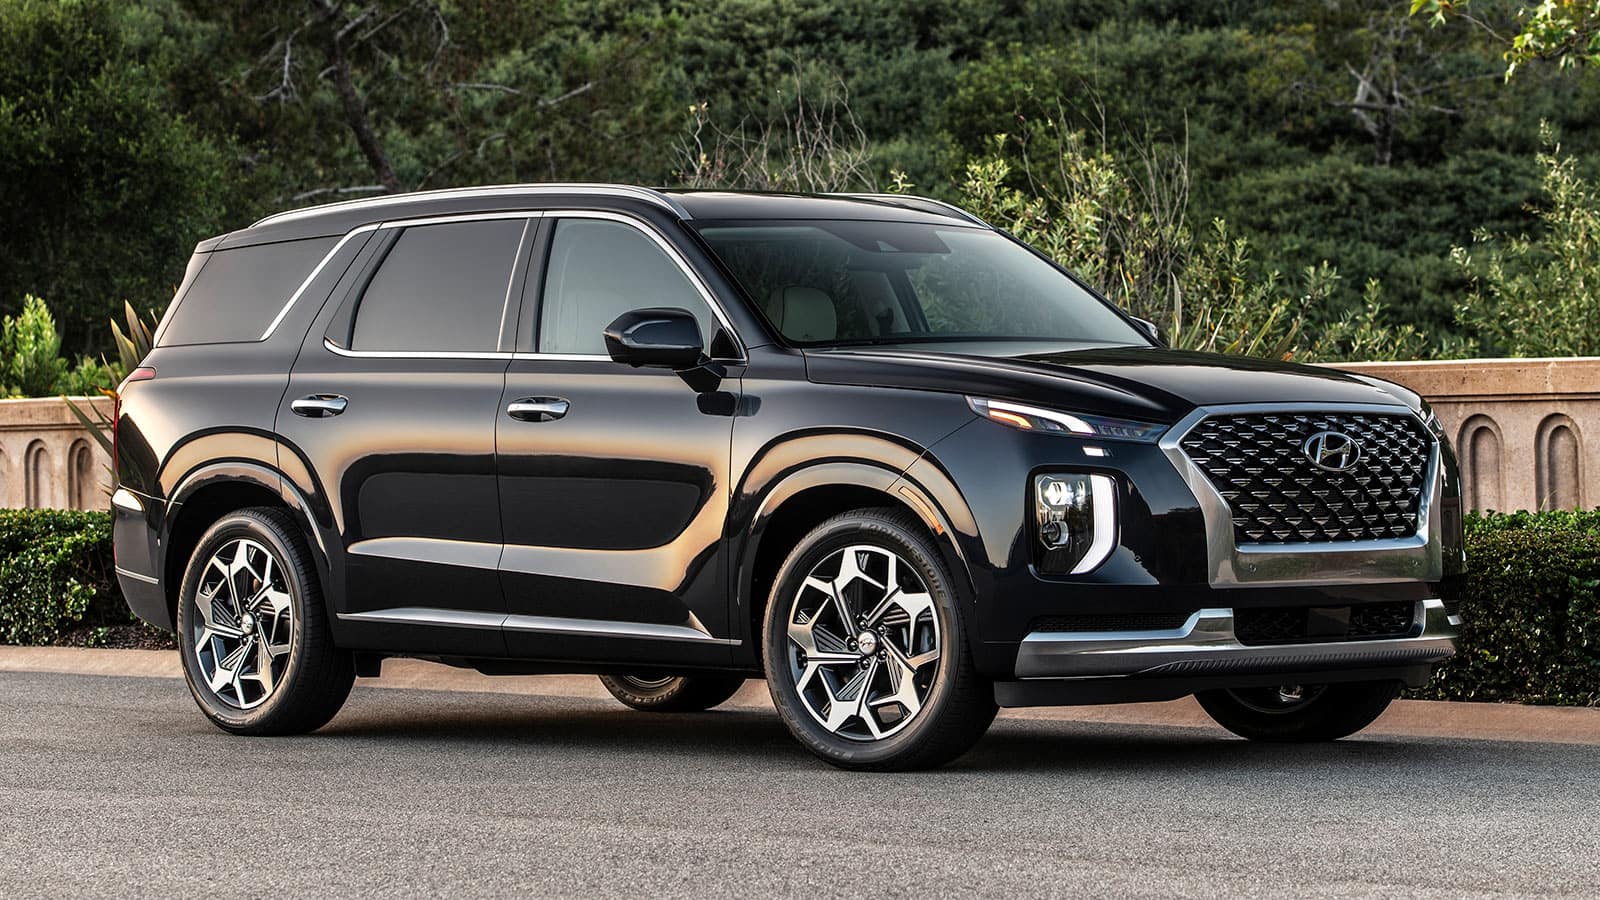
The Palisade is the spiritual successor to the Hyundai Veracruz which was discontinued in 2012 and directly replaces the Hyundai Santa Fe XL which was discontinued when the new generation Santa Fe was launched in 2019. The Hyundai Palisade is a full-size SUV that was introduced in 2018. It is the largest SUV in Hyundai’s lineup and is positioned above the Santa Fe.
The Palisade is available in three trim levels: SE, Limited, and Calligraphy. It is powered by a 3.8L V6 engine that produces 291 horsepower and 262 lb-ft of torque. It is mated to an 8-speed automatic transmission. The Palisade is praised for its spacious interior, its comfortable ride, and its long list of standard features. It is also praised for its good fuel economy for a vehicle of its size. However, the Palisade has been criticized for its high price tag, its lack of off-road capability, and its unrefined ride quality on the highway.
The Hyundai Palisade is a good SUV, but it is not a great SUV. It is a good option for buyers who are looking for a comfortable and spacious SUV for family use. However, if you are looking for an SUV with off-road capability or a more refined ride quality, you may want to consider a different SUV
Hyundai Palisade US Sales Data & Charts
US Monthly Sales
US Annual Sales
| Year | Sales Units |
|---|---|
| 2019 | 28,736 |
| 2020 | 81,905 |
| 2021 | 86,282 |
| 2022 | 82,688 |
| 2023 | 89,509 |
| 2024 | 25,255 |


