
Hyundai Kona
Here you will find monthly and yearly Canadian, European and U.S. sales figures for the Hyundai Kona. The Hyundai Kona is a subcompact crossover SUV introduced by the South Korean manufacturer Hyundai. Since its debut, the Kona has become an important model for Hyundai in the rapidly growing subcompact SUV segment, popular for its unique design, advanced technology features, and versatility. It is available in both gasoline and electric (Kona Electric) models.
Hyundai Kona Overview
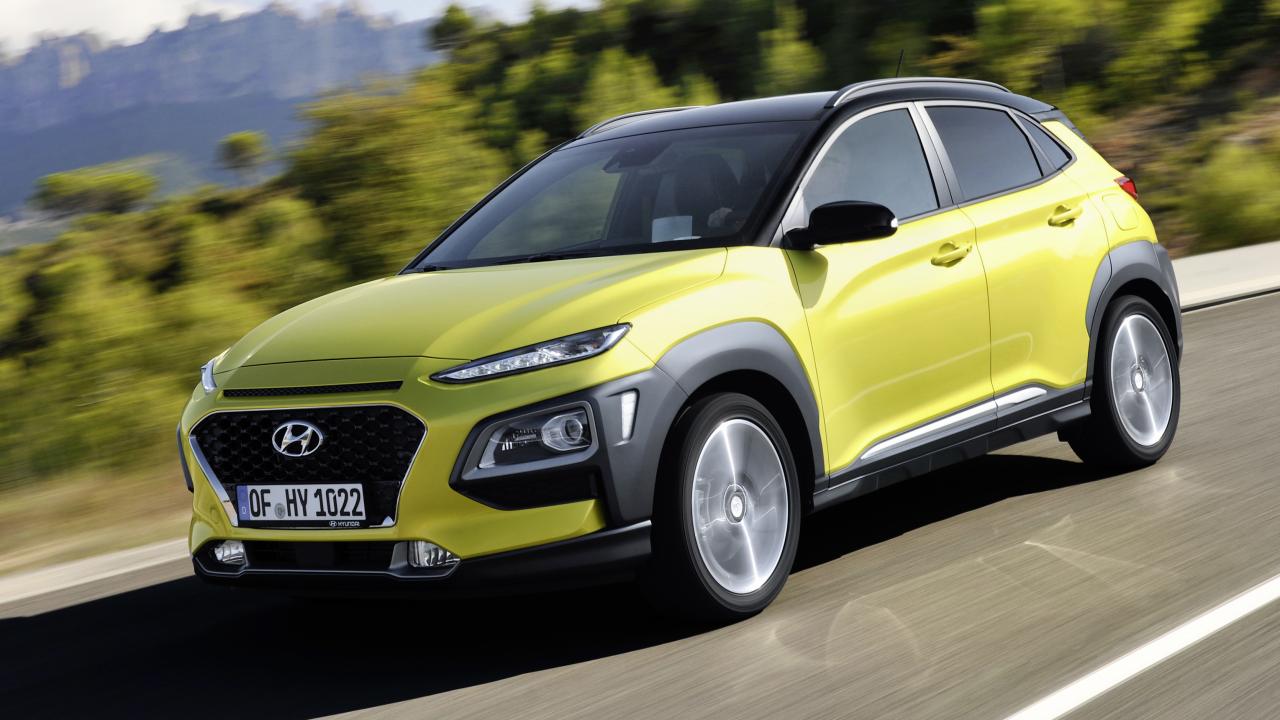
The Hyundai Kona was first introduced in 2017 and quickly gained attention for its bold and distinctive design. The Kona’s design stands out with sharp lines, a cascading grille, and a unique headlamp architecture that separates the LED daytime running lights from the main headlamps. The vehicle’s compact size, combined with its aggressive design elements, gives it a distinctive presence in its segment.
The gasoline-powered Kona is powered by a 2.0-liter four-cylinder engine that produces 147 horsepower and 132 lb-ft of torque. It is available with front-wheel drive or all-wheel drive. The Kona Electric is powered by a 64.0-kWh lithium-ion battery that provides a range of up to 258 miles.
The Kona is available in SE, SEL, Limited, and N Line trim levels. The SE is the base trim level and comes standard with features like a 6.5-inch touchscreen infotainment system, Bluetooth, and a rearview camera. The SEL adds features like an 8.0-inch touchscreen infotainment system, a sunroof, and heated front seats. The Limited adds features like a 10.25-inch touchscreen infotainment system, a JBL sound system, and leather seats. The N Line is the sport-tuned trim level and adds features like a unique front fascia, sport-tuned suspension, and 18-inch wheels.
The Kona has been praised for its stylish design, comfortable interior, and long list of standard features. It has also been awarded several awards, including the 2019 North American SUV of the Year and the 2020 Top Safety Pick+ from the Insurance Institute for Highway Safety (IIHS). The Hyundai Kona Electric, in particular, has garnered attention as one of the more affordable electric vehicles with a competitive range, making electric mobility more accessible to a broader audience.
Hyundai Kona Sales Figures
The Hyundai Kona has been generally well-received by automotive journalists and consumers alike. It’s often praised for its unique design, value proposition (given its features and price point), and, in the case of the electric model, its impressive range. The Kona has performed well in numerous markets worldwide, including North America, Europe, and Asia. Its combination of style, features, and competitive pricing has made it a popular choice among consumers looking for a compact SUV.
Hyundai Kona US Sales Data & Charts
US Monthly Sales
US Annual Sales
| Year | Sales Units |
|---|---|
| 2018 | 47,090 |
| 2019 | 73,326 |
| 2020 | 76,253 |
| 2021 | 89,607 |
| 2022 | 63,994 |
| 2023 | 79,116 |
| 2024 | 23,054 |
US Annual Growth
Hyundai Kona Canada Sales Data & Charts
Canada Annual Sales
| Year | Sales Units |
|---|---|
| 2011 | 2,564 |
| 2018 | 14,497 |
| 2019 | 25,817 |
| 2020 | 31,733 |
| 2021 | 31,101 |
| 2022 | 13,673 |
Europe Annual Growth
Hyundai Kona Europe Sales Data & Charts
Europe Annual Sales
| Year | Sales Units |
|---|---|
| 2017 | 6,884 |
| 2018 | 65,469 |
| 2019 | 105,030 |
| 2020 | 126,980 |
| 2021 | 109,934 |
| 2022 | 97,817 |


Why choose the Hyundai Kona?
1. Recommended by Consumer Reports and Car and Driver.magazines.
2. Affordable, economical, reliable and fun
3. Multiple trim packages
4. Safety features and great crash ratings
5. Unique styling
6. Great technology and option packages
7. The best warranty in the marketplace. Better than all competitors.