
Hyundai Elantra
Here you will find monthly and yearly Canadian, Chinese and U.S. market sales figures for the Hyundai Elantra. The Hyundai Elantra is a compact car produced by the South Korean automaker Hyundai. Since its debut, the Elantra has been one of Hyundai’s most popular and best-selling models worldwide. The vehicle is known for its value proposition, offering a combination of modern design, features, and an attractive price point.
Hyundai Elantra Overview
The Hyundai Elantra was first introduced in 1990. It was initially marketed as a compact car, and over the years, it has seen considerable growth in terms of size, features, and market positioning. Over the years, the Elantra has been offered with various gasoline engine options, and more recently, hybrid variants have been added to the lineup. The transmission options have typically included manual, automatic, and dual-clutch versions. The modern iterations of the Elantra come equipped with a host of features, including touchscreen infotainment systems, Apple CarPlay, Android Auto, advanced driver assistance systems, and more.
The Elantra has been well-received in many markets, especially in North America, for its value for money, reliability, and comprehensive warranty. It has won numerous awards and accolades over its lifespan. The Elantra is sold under different names in various markets. For instance, it’s known as the “Hyundai Avante” in the South Korean domestic market.
The Elantra is available in both gasoline and hybrid models. Gasoline-powered models are powered by a 2.0L four-cylinder engine that produces 147 horsepower and 132 pound-feet of torque. Hybrid models are powered by a 1.6L turbocharged four-cylinder engine and an electric motor that produce a combined 139 horsepower and 195 pound-feet of torque. All models come standard with front-wheel drive, but all-wheel drive is available on hybrid models. The Elantra is known for its stylish design, comfortable ride, and long list of features.
Hyundai Elantra Sales Figures
Hyundai Elantra US Sales Data & Charts
US Monthly Sales
US Annual Sales
| Year | Sales Units |
|---|---|
| 2005 | 116,336 |
| 2006 | 98,853 |
| 2007 | 85,724 |
| 2008 | 94,720 |
| 2009 | 103,269 |
| 2010 | 132,246 |
| 2011 | 186,361 |
| 2012 | 215,854 |
| 2013 | 247,912 |
| 2014 | 222,023 |
| 2015 | 241,706 |
| 2016 | 208,319 |
| 2017 | 198,210 |
| 2018 | 200,415 |
| 2019 | 175,094 |
| 2020 | 105,475 |
| 2021 | 127,360 |
| 2022 | 117,177 |
| 2023 | 134,149 |
| 2024 | 26,860 |
US Annual Growth
Hyundai Elantra Canada Sales Data & Charts
Canada Annual Sales
| Year | Sales Units |
|---|---|
| 2011 | 2,436 |
| 2012 | 50,950 |
| 2013 | 54,760 |
| 2014 | 50,420 |
| 2015 | 43,687 |
| 2016 | 48,875 |
| 2017 | 46,112 |
| 2018 | 41,784 |
| 2019 | 39,463 |
| 2020 | 25,006 |
| 2021 | 26,312 |
| 2022 | 11,379 |
Canada Annual Growth
Hyundai Elantra China Sales Data & Charts
As of 2016, Hyundai sells no less than 4 different generations of the Elantra: this Hyundai Elantra, mostly sold to taxi companies, but also the Elantra Yuedong, the Elantra Langdon and the latest generation called Elantra Lingdong.
China Annual Sales
| Year | Sales Units |
|---|---|
| 2003 | 178 |
| 2004 | 102,748 |
| 2005 | 176,589 |
| 2006 | 169,716 |
| 2007 | 120,333 |
| 2008 | 117,761 |
| 2009 | 171,605 |
| 2010 | 152,641 |
| 2011 | 113,368 |
| 2012 | 64,363 |
| 2013 | 34,454 |
| 2014 | 32,236 |
| 2015 | 13,304 |
| 2016 | 3,891 |
| 2020 | 39,949 |
| 2021 | 130,839 |
| 2022 | 90,917 |
China Annual Growth
Hyundai Elantra Generations
First Generation (J1; 1990-1995)
The initial model was launched as a replacement for the Hyundai Stellar. It had a relatively simple design and was primarily targeted at affordability. The first-generation Elantra was a compact car that was based on the Hyundai Excel platform. It was available with a 1.5L four-cylinder engine that produced 86 horsepower and 106 pound-feet of torque.
Second Generation (J2; 1995-2000)
Featuring a more refined design and improved features, this generation began to move the Elantra toward a more competitive stance in its segment. The second-generation Elantra was a major redesign that introduced a more modern design and a wider range of engine options. It was available with a 1.5L four-cylinder engine that produced 92 horsepower and 111 pound-feet of torque, and a 1.6L four-cylinder engine that produced 105 horsepower and 106 pound-feet of torque.
Third Generation (XD; 2000-2006)
This generation brought a more modern design and better build quality, with improvements in safety and performance. The third-generation Elantra was another major redesign that introduced a more stylish design and a more advanced interior. It was available with a 1.6L four-cylinder engine that produced 105 horsepower and 106 pound-feet of torque, and a 2.0L four-cylinder engine that produced 138 horsepower and 136 pound-feet of torque.
Fourth Generation (HD; 2006-2010)
The Elantra continued to mature with an even more refined design, improved interior quality, and better fuel efficiency. The fourth-generation Elantra was a facelift of the third generation that introduced a few minor changes to the exterior and interior. It was available with the same engine options as the third generation.
Fifth Generation (MD/UD; 2010-2015)
The fifth-gen Elantra had a fluidic design, reflecting Hyundai’s new design philosophy at the time. It was well-received and gained several awards for its design and value proposition. The fifth-generation Elantra was a major redesign that introduced a more stylish design and a more advanced interior. It was available with a 1.8L four-cylinder engine that produced 148 horsepower and 134 pound-feet of torque, and a 2.0L four-cylinder engine that produced 173 horsepower and 154 pound-feet of torque.
Sixth Generation (AD; 2015-2020)
A more mature and angular design characterized this generation. Hyundai also focused on improving the car’s safety features, technology, and overall driving experience. The sixth-generation Elantra was a facelift of the fifth generation that introduced a few minor changes to the exterior and interior. It was available with the same engine options as the fifth generation.
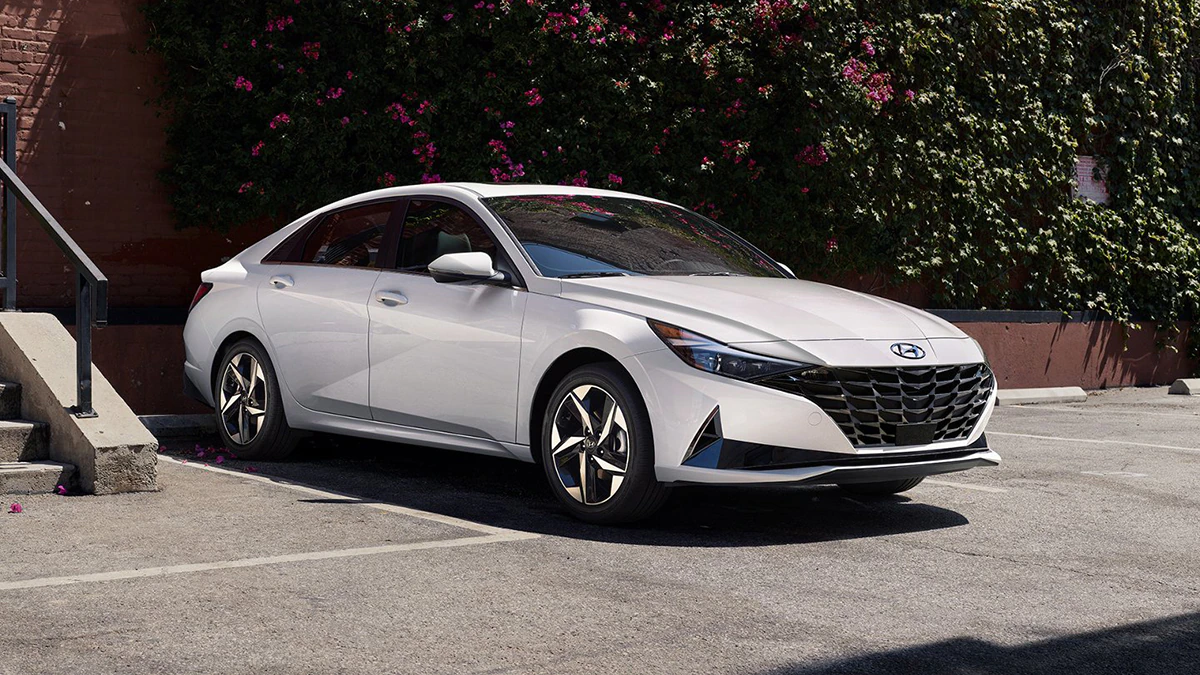
Seventh Generation (CN7; 2020-Present)
Unveiled in 2020, this generation features a bold and aggressive design, with a parametric-jewel-pattern grille and angular lines. The interior also saw significant upgrades, with a focus on technology and modern aesthetics. The seventh-generation Elantra is the latest redesign and is based on the Hyundai K3 platform. It is available with a 2.0L four-cylinder engine that produces 147 horsepower and 132 pound-feet of torque, and a 1.6L turbocharged four-cylinder engine and an electric motor that produce a combined 139 horsepower and 195 pound-feet of torque.


