
Hyundai Accent
Here you will find monthly and yearly Canadian, European, Chinese and U.S. sales figures for the Hyundai Accent. The Hyundai Accent is a subcompact car manufactured by Hyundai Motor Company. It is currently in its seventh generation, which was introduced in 2020. The Hyundai Accent is a good choice for those looking for a fuel-efficient and affordable subcompact car. It is also a good choice for first-time car buyers.
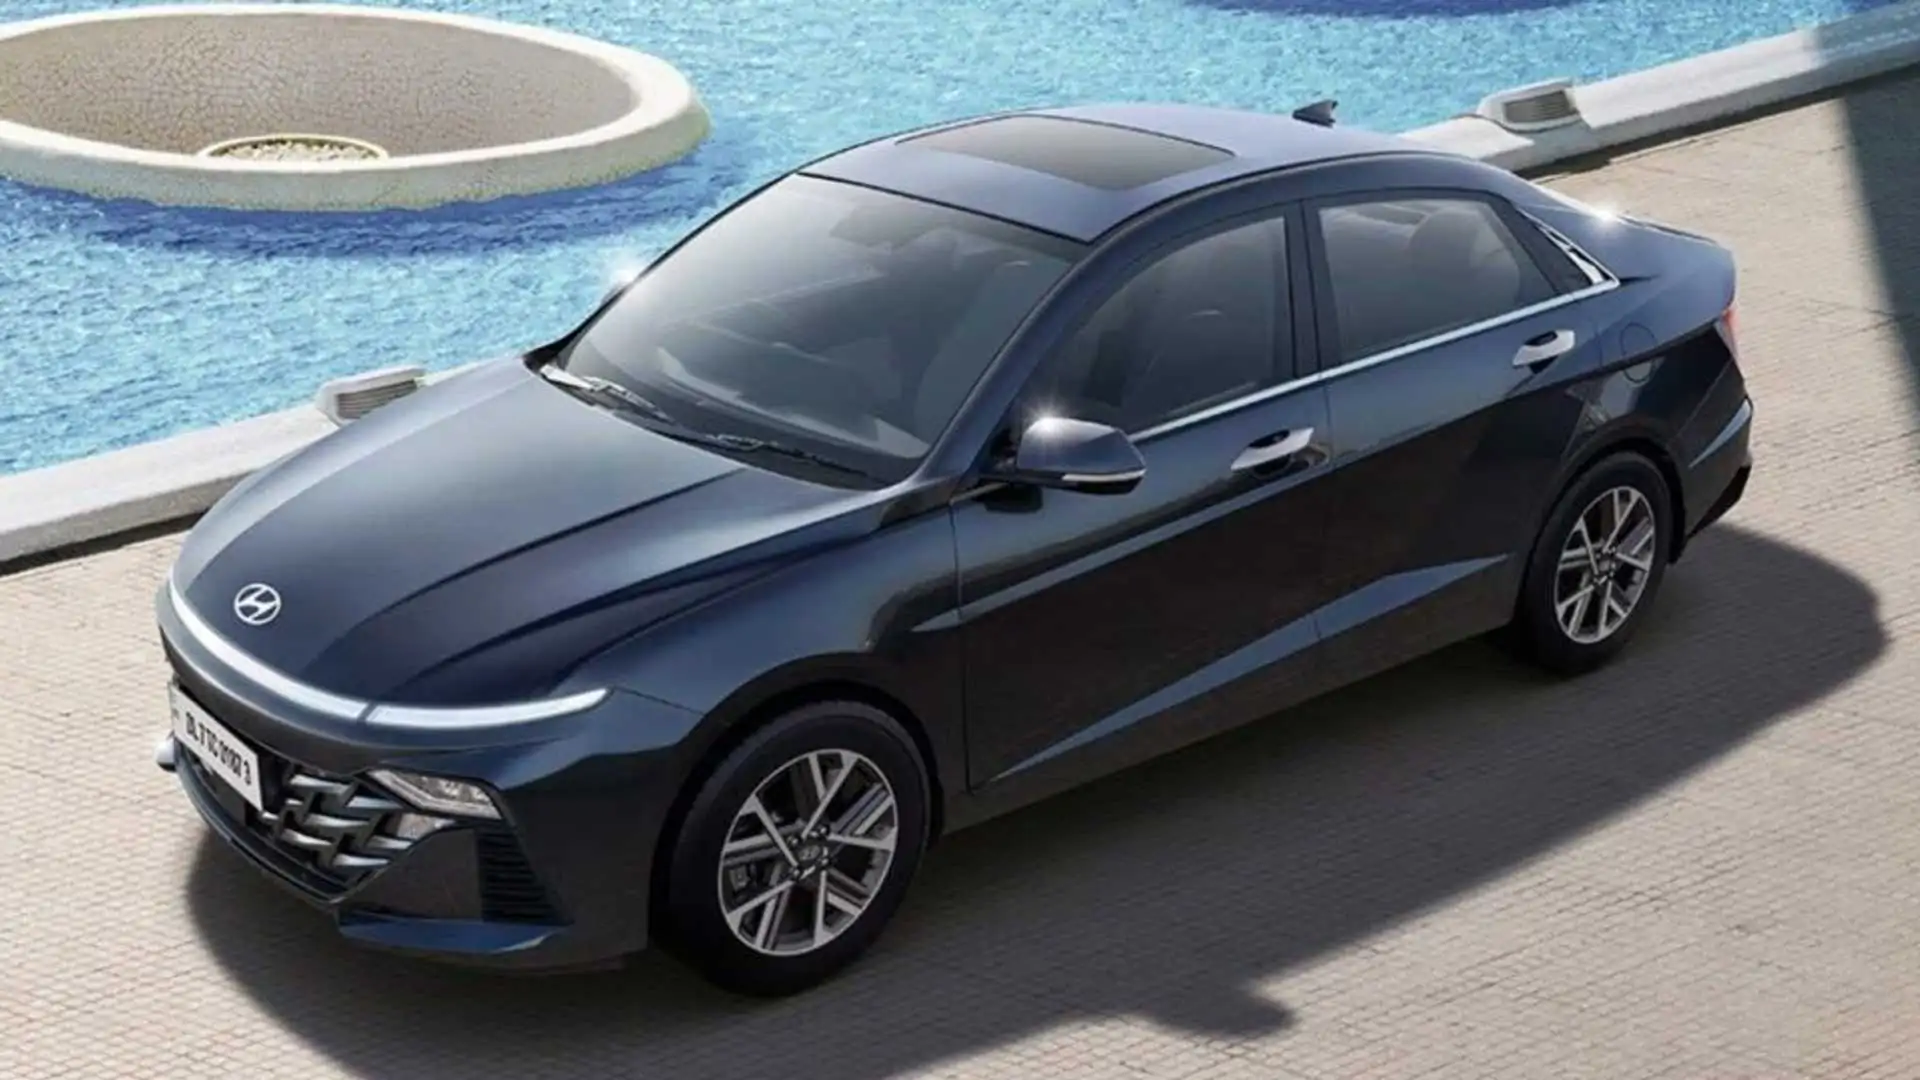
Hyundai Accent Overview
The Hyundai Accent, known in some markets as the Hyundai Verna, is a subcompact car produced by the South Korean manufacturer Hyundai. Introduced in the early 1990s, the Accent became a key offering in Hyundai’s lineup due to its affordability, reliability, and efficiency. Debuted in 1994, replacing the Excel in Hyundai’s lineup.
The currentAccent is powered by a 1.6L four-cylinder engine that produces 120 horsepower and 113 lb-ft of torque. It is available with a six-speed manual transmission or a continuously variable automatic transmission (CVT). The Accent is known for its fuel efficiency. It gets an EPA-estimated 33 mpg in the city and 41 mpg on the highway with the CVT. The Accent is also known for its affordability. It starts at $16,645, which is one of the lowest starting prices in the subcompact car class. The Accent comes standard with a variety of features, including a 6.5-inch touchscreen infotainment system with Apple CarPlay and Android Auto, a rearview camera, and six speakers. Available features include a 8-inch touchscreen infotainment system, a blind spot monitoring system, rear cross traffic alert, and a proximity key with push-button start.
Hyundai Accent Sales Figures
Hyundai Accent U.S Sales Data & Charts
US Monthly Sales
US Annual Sales
| Year | Sales Units |
|---|---|
| 2005 | 44,012 |
| 2006 | 34,735 |
| 2007 | 36,055 |
| 2008 | 50,431 |
| 2009 | 67,086 |
| 2010 | 51,975 |
| 2011 | 55,601 |
| 2012 | 66,810 |
| 2013 | 60,458 |
| 2014 | 63,309 |
| 2015 | 61,486 |
| 2016 | 79,766 |
| 2017 | 58,955 |
| 2018 | 29,090 |
| 2019 | 25,628 |
| 2020 | 15,975 |
| 2021 | 18,868 |
| 2022 | 17,823 |
| 2023 | 31 |
US Annual Growth
Hyundai Accent Canada Sales Data & Charts
Canada Annual Sales
| Year | Sales Units |
|---|---|
| 2012 | 22,581 |
| 2013 | 18,884 |
| 2014 | 23,173 |
| 2015 | 17,901 |
| 2016 | 19,198 |
| 2017 | 13,073 |
| 2018 | 9,021 |
| 2019 | 5,989 |
| 2020 | 3,018 |
Canada Annual Growth
Hyundai Accent Europe Sales Data & Charts
Europe Annual Sales
| Year | Sales Units |
|---|---|
| 1997 | 73,131 |
| 1998 | 63,405 |
| 1999 | 59,739 |
| 2000 | 70,144 |
| 2001 | 57,431 |
| 2002 | 41,819 |
| 2003 | 32,575 |
| 2004 | 52,214 |
| 2005 | 50,715 |
| 2006 | 18,342 |
| 2007 | 18,588 |
| 2008 | 10,082 |
| 2009 | 5,575 |
| 2010 | 1,800 |
Europe Annual Growth
Hyundai Accent China Sales Data & Charts
China Annual Sales
| Year | Sales Units |
|---|---|
| 2007 | 26,548 |
| 2008 | 24,628 |
| 2009 | 60,379 |
| 2010 | 68,463 |
| 2011 | 19,557 |
| 2012 | 3,200 |
| 2013 | 398 |
| 2022 | 201 |
China Annual Growth
Hyundai Accent Generations
First Generation (X3; 1994-1999)
Debuted in 1994, replacing the Excel in Hyundai’s lineup. The first generation Accent was a subcompact hatchback that was available in both two-door and four-door body styles. It was powered by a 1.5L four-cylinder engine. Driven by a range of gasoline engines and even a diesel in some markets.
Second Generation (LC; 1999-2005)
The second generation Accent was a major redesign that introduced a new platform and engines. It was also available in a sedan body style for the first time. Featured more improvements in safety and build quality. Engines were updated and included a range of gasoline options and a diesel variant in specific markets.
Third Generation (MC; 2005-2011)
The third generation Accent was a refinement of the second generation design. It was available with a new 1.6L four-cylinder engine. Offered improved design, quality, and features. It was available primarily as a sedan, but some markets received a hatchback variant.
Fourth Generation (RB; 2010-2017)
The fourth generation Accent was a major redesign that introduced a new platform and engines. It was also available with a hatchback body style again. Further upgrades in design, making the car look more modern and up-to-date. Continued improvements in safety, build quality, and interior features. Introduced more efficient engines, with a focus on fuel economy.
Fifth Generation (HC; 2017-2022)
The fifth generation Accent was a refinement of the fourth generation design. It was available with a new 1.6L four-cylinder engine and a CVT. Adopted Hyundai’s newer design language, giving the Accent a more mature and upscale appearance. Focus on advanced safety features, infotainment options, and improved driving dynamics.
Sixth Generation (2023-Present)
The sixth generation Accent is the latest generation. It is a major redesign that introduces a new design, interior, and technology. It is available with a 1.6L four-cylinder engine and a CVT.


