
GMC Yukon
Here you will find monthly and yearly Canadian and U.S. sales figures for the GMC Yukon. The GMC Yukon is a full-size SUV manufactured by GMC, a division of General Motors. It was first introduced in 1992 and is currently in its fifth generation. Overall, the GMC Yukon is a good value full-size SUV. It is powerful, capable, and spacious. However, it is not as fuel-efficient as some rivals and the infotainment system can be slow.
GMC Yukon Overview
The GMC Yukon is a full-sized SUV produced by General Motors under the GMC brand. A cousin to the Chevrolet Tahoe and Chevrolet Suburban, the Yukon is known for its blend of utility, luxury, and robust performance. It’s a versatile vehicle that’s used for everything from family transportation to towing and even off-road adventures in its more rugged configurations.
The GMC Yukon debuted in 1991 as a rebadged version of the Chevrolet Blazer. Over the years, it diverged in terms of trim and features, cementing its place in the luxury SUV market. The Yukon underwent several redesigns, moving from a two-door model in its early days to the primarily four-door version we recognize today.
Over the years, the Yukon has been offered with a variety of powertrains, from V8 gasoline engines to hybrid versions (available for a brief period). The recent models are known for their robust V8 engines, delivering ample power and torque, making the Yukon a capable towing vehicle.
The current Yukon is available in three trim levels: SLE, SLT, and Denali. It is available in two wheelbases: 133.0 inches and 144.1 inches. It is also available in two body styles: standard and extended. The Yukon is available with a choice of three engines: a 5.3L V8 engine, a 6.2L V8 engine, and a 3.0L inline-six turbodiesel engine. It is available in both rear-wheel drive and four-wheel drive configurations. The Yukon is known for its powerful engines, good towing capacity, and spacious interior. It is also known for its off-road capability. The Yukon can tow up to 8,100 pounds with the 5.3L V8 engine and up to 8,400 pounds with the 6.2L V8 engine.
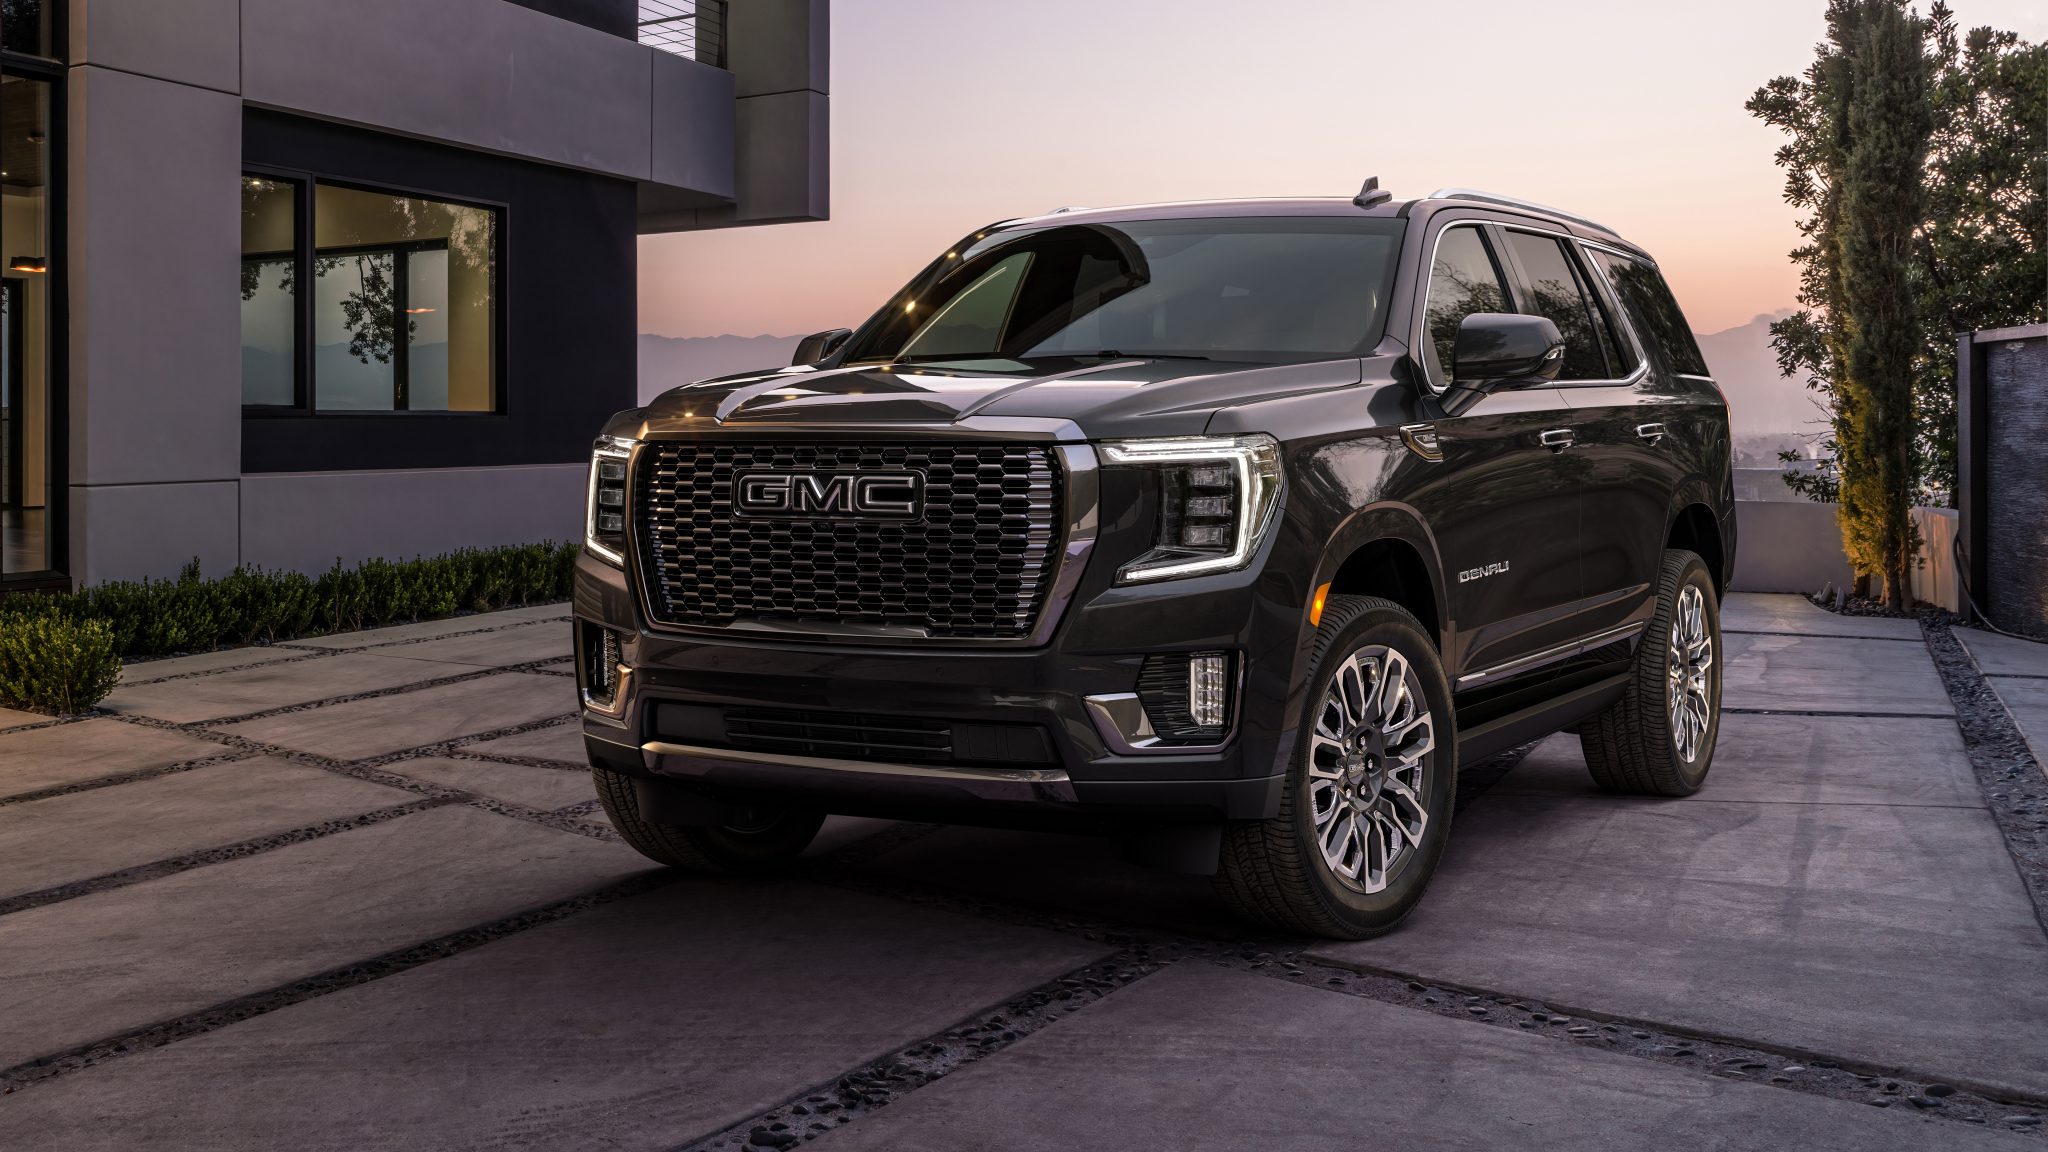
The Yukon comes standard with a variety of features, including a rearview camera, power windows and locks, and a six-speaker sound system. Available features include a sunroof, a leather interior, and a Bose sound system. The Yukon is also available in a performance-oriented version called the GMC Yukon Denali. The GMC Yukon Denali is equipped with a 6.2L V8 engine and a sport-tuned suspension.
The GMC Yukon competes in the full-size SUV segment against vehicles like the Ford Expedition, Toyota Sequoia, and its GM siblings – the Chevrolet Tahoe, Chevrolet Suburban, and Cadillac Escalade. The Yukon has been a successful model for GMC, both in terms of sales and reputation. It’s often lauded for its combination of power, luxury, and versatility.
GMC Yukon Sales Figures
GMC Yukon US Sales Data & Charts
US Monthly Sales
US Annual Sales
| Year | Sales Units |
|---|---|
| 2005 | 73,458 |
| 2006 | 71,476 |
| 2007 | 63,428 |
| 2008 | 39,064 |
| 2009 | 29,411 |
| 2010 | 28,781 |
| 2011 | 34,250 |
| 2012 | 29,943 |
| 2013 | 28,302 |
| 2014 | 41,569 |
| 2015 | 42,732 |
| 2016 | 53,447 |
| 2017 | 49,183 |
| 2018 | 74,678 |
| 2019 | 74,672 |
| 2020 | 63,442 |
| 2021 | 84,243 |
| 2022 | 82,305 |
| 2023 | 82,270 |
| 2024 | 18,012 |
US Annual Growth
GMC Yukon Canada Sales Data & Charts
Canada Annual Sales
| Year | Sales Units |
|---|---|
| 2012 | 1,093 |
| 2013 | 1,333 |
| 2014 | 2,005 |
| 2015 | 1,711 |
| 2016 | 2,842 |
| 2017 | 3,514 |
| 2018 | 3,061 |
| 2019 | 2,925 |
| 2020 | 3,725 |
| 2021 | 8,338 |


