
GMC Yukon XL
Here you will find monthly and yearly Canadian and U.S. sales figures for the GMC Yukon XL. The Yukon XL is a good choice for those who need a large and capable SUV. It is also a good choice for those who need an SUV that can tow a lot of weight.
GMC Yukon XL Overview
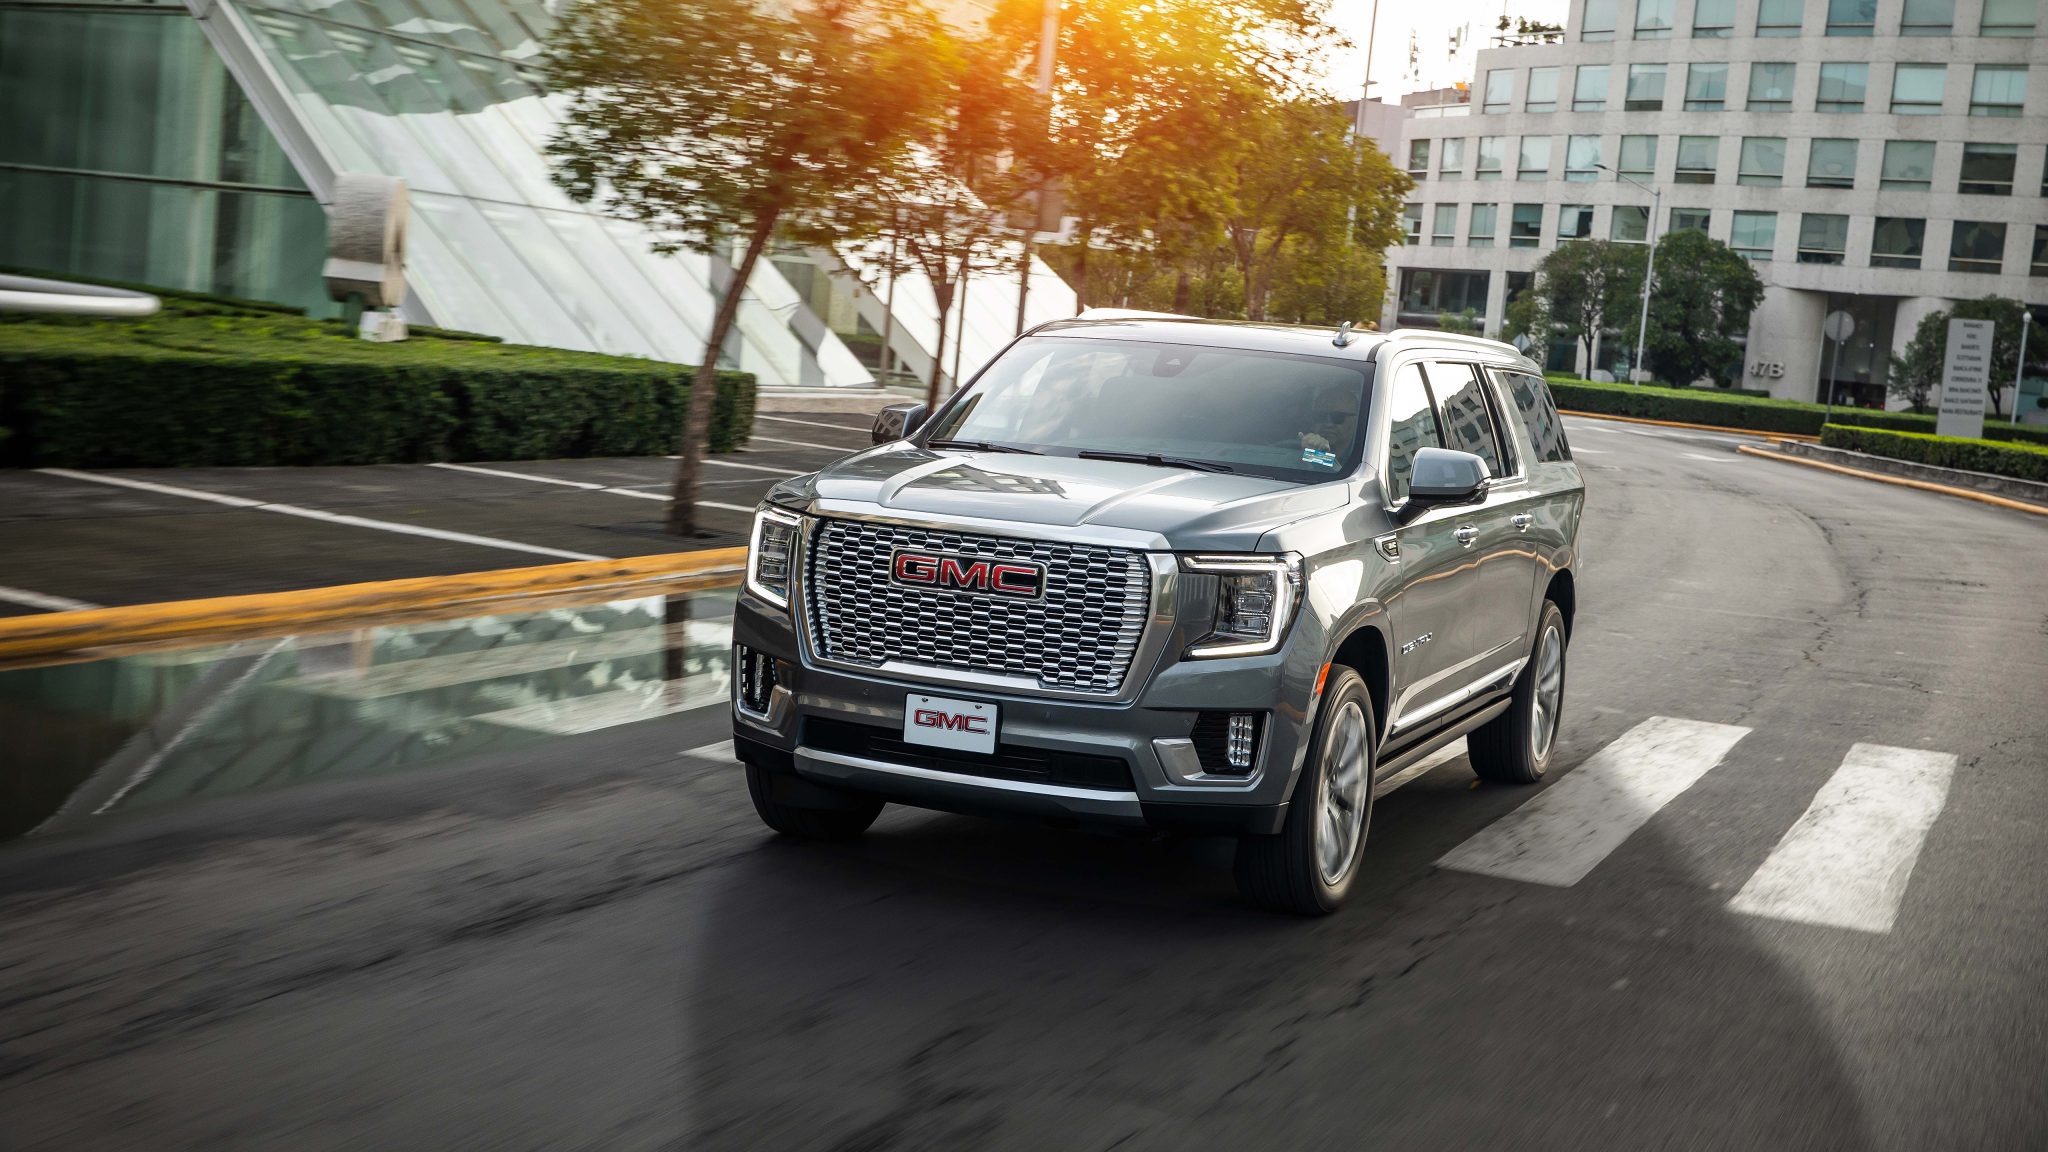
The GMC Yukon XL is a full-size SUV manufactured by GMC, a division of General Motors. It is the extended-length version of the GMC Yukon and is available in three trim levels: SLE, SLT, and Denali. The Yukon XL is available with a choice of three engines: a 5.3L V8 engine, a 6.2L V8 engine, and a 3.0L inline-six turbodiesel engine. It is available in both rear-wheel drive and four-wheel drive configurations.
The Yukon XL is known for its spacious interior, good towing capacity, and off-road capability. It is also known for its comfortable ride. The Yukon XL can tow up to 8,400 pounds with the 5.3L V8 engine and up to 9,200 pounds with the 6.2L V8 engine. The Yukon XL comes standard with a variety of features, including a rearview camera, power windows and locks, and a six-speaker sound system. Available features include a sunroof, a leather interior, and a Bose sound system.
GMC Yukon XL Sales Figures
GMC Yukon XL US Sales Data & Charts
US Annual Sales
| Year | Sales Units |
|---|---|
| 2005 | 53,652 |
| 2006 | 45,413 |
| 2007 | 45,285 |
| 2008 | 26,404 |
| 2009 | 16,819 |
| 2010 | 23,797 |
| 2011 | 25,223 |
| 2012 | 24,671 |
| 2013 | 31,258 |
| 2014 | 29,752 |
| 2015 | 31,334 |
| 2016 | 37,054 |
| 2017 | 35,059 |
| 2018 | 6,108 |
US Annual Growth
GMC Yukon XL Canada Sales Data & Charts
Canada Annual Sales
| Year | Sales Units |
|---|---|
| 2012 | 974 |
| 2013 | 1,171 |
| 2014 | 1,760 |
| 2015 | 1,579 |
| 2016 | 2,604 |
| 2017 | 2,788 |
| 2018 | 2,266 |
| 2019 | 2,234 |
| 2020 | 498 |


