
GMC Terrain
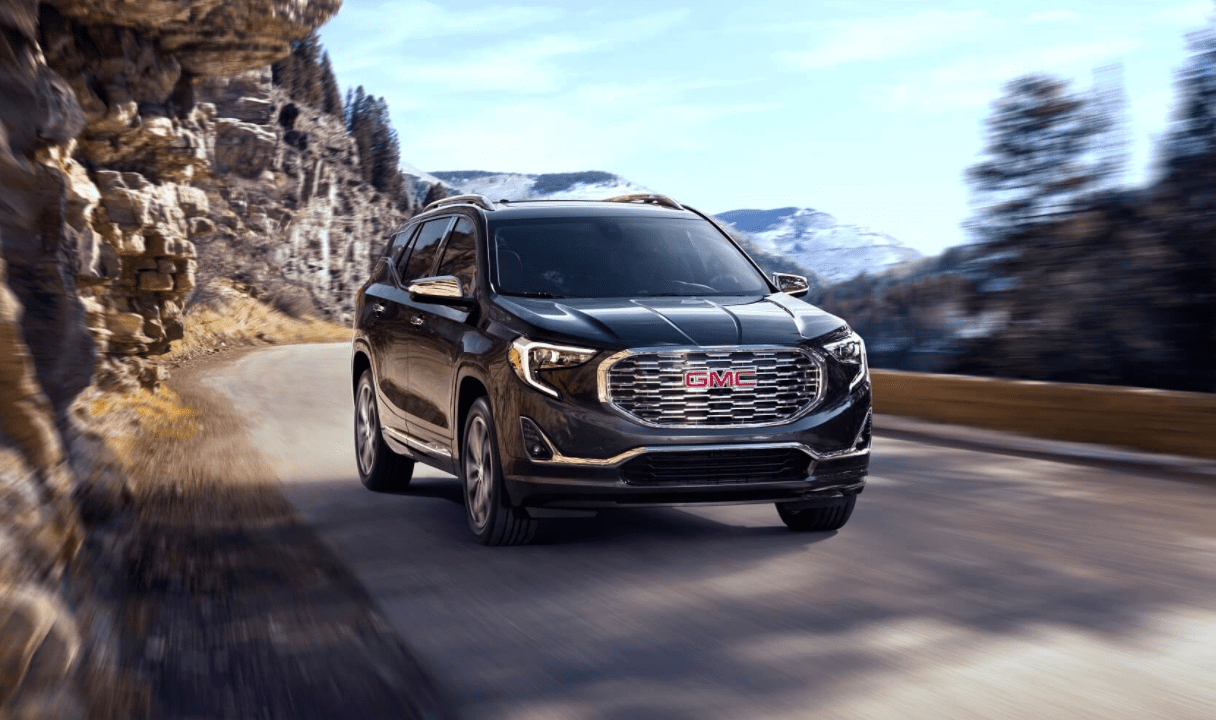
Here you will find monthly and yearly Canadian and U.S. sales figures for the GMC Terrain. The GMC Terrain is a compact crossover SUV manufactured by GMC, a division of General Motors. It was first introduced in 2010 and is currently in its third generation. Overall, the GMC Terrain is a good value compact crossover SUV. It is comfortable, spacious, and has a long list of standard features. However, it is not as fuel-efficient as some rivals and the infotainment system can be slow. The Terrain is also available in a performance-oriented version called the GMC Terrain Denali. The GMC Terrain Denali is equipped with a 2.0L turbocharged four-cylinder engine and a sport-tuned suspension. The GMC Terrain Denali is more expensive than the regular Terrain, but it is also more capable and has a more luxurious interior.
GMC Terrain Overview
The GMC Terrain is a compact crossover SUV produced by General Motors under its GMC marque. Since its introduction, the Terrain has been an essential part of GMC’s lineup, providing an option for buyers who are looking for a combination of style, technology, and functionality in a smaller SUV package than the larger GMC Acadia.
The Terrain is considered a compact SUV, slotting below the mid-size GMC Acadia in the brand’s lineup. This makes it a suitable choice for urban dwellers who need SUV capabilities without the size of a full-scale model. The GMC Terrain has historically offered a mix of powertrains. In its second generation, the emphasis shifted towards turbocharged engines, which included a 1.5L turbo-four, a 2.0L turbo-four, and for a period, a 1.6L turbo-diesel. The Terrain’s interior is known for being both functional and upscale, especially in higher trims. Modern models include a range of tech features, including GMC’s infotainment system, a touchscreen display, Apple CarPlay, Android Auto, and various active safety features. Like other GMC vehicles, the Terrain is available in a range of trims, from the base SL to the more luxurious Denali. The Denali trim, in particular, offers premium touches, unique styling cues, and additional features.
The GMC Terrain competes in the crowded compact SUV segment against vehicles like the Honda CR-V, Toyota RAV4, Ford Escape, and its sibling, the Chevrolet Equinox. Over the years, the Terrain has enjoyed good sales figures, reflecting the overall market trend of increasing demand for SUVs and crossovers.
GMC Terrain Sales Figures
GMC Terrain US Sales Data & Charts
US Monthly Sales
US Annual Sales
| Year | Sales Units |
|---|---|
| 2009 | 14,033 |
| 2010 | 60,519 |
| 2011 | 83,179 |
| 2012 | 105,872 |
| 2013 | 98,625 |
| 2014 | 105,016 |
| 2015 | 112,030 |
| 2016 | 87,925 |
| 2017 | 85,441 |
| 2018 | 114,311 |
| 2019 | 101,470 |
| 2020 | 86,020 |
| 2021 | 47,488 |
| 2022 | 86,568 |
| 2023 | 71,856 |
| 2024 | 21,864 |
US Annual Growth
GMC Terrain Canada Sales Data & Charts
Canada Annual Sales
| Year | Sales Units |
|---|---|
| 2012 | 11,231 |
| 2013 | 11,802 |
| 2014 | 11,524 |
| 2015 | 10,844 |
| 2016 | 11,095 |
| 2017 | 13,205 |
| 2018 | 12,877 |
| 2019 | 12,023 |
| 2020 | 9,848 |
| 2021 | 7,238 |
Canada Annual Growth
GMC Terrain Generations


