
Genesis G80
Here you will find monthly and yearly Canadian, European and U.S. sales figures for the Genesis G80. The Genesis G80 is a luxury mid-size sedan that was first introduced in 2016. It is the flagship sedan of the Genesis brand, which is a luxury brand owned by Hyundai.
Genesis G80 Overview
The Genesis G80 is a luxury midsize sedan produced by Genesis, the luxury vehicle division of Hyundai Motor Group. Initially launched as the second-generation Hyundai Genesis (before the brand separation), the G80 has since become a core model in Genesis’s lineup, exemplifying the brand’s commitment to luxury, innovation, and design. Before the creation of the standalone Genesis brand, the first-generation of this vehicle was sold as the Hyundai Genesis. In 2015, when Hyundai decided to spin off Genesis as a separate luxury brand, the Hyundai Genesis was renamed the Genesis G80 starting from its second generation. The G80 sits in the middle of the Genesis sedan lineup, between the smaller G70 and the larger, more opulent G90.
The G80 is available with two engine options: a 3.8L V6 engine that produces 311 horsepower and 293 lb-ft of torque, and a 3.5L twin-turbocharged V6 engine that produces 375 horsepower and 391 lb-ft of torque. Both engines are paired with an eight-speed automatic transmission.
The G80 is available in rear-wheel drive or all-wheel drive configurations. It has a spacious and comfortable interior with high-quality materials. It comes standard with a long list of features, including a 12.3-inch digital instrument cluster, a 14.5-inch touchscreen infotainment system, a 12-speaker Lexicon sound system, and a panoramic sunroof. The G80 has been praised for its luxurious interior, comfortable ride, and long list of standard features. It has also been awarded several awards, including the 2022 MotorTrend Car of the Year.
Genesis G80 Generations
- First Generation (as Hyundai Genesis; 2008–2013): This model was Hyundai’s initial foray into the luxury sedan segment. It featured rear-wheel-drive architecture, multiple engine options (including V6 and V8 offerings), and garnered attention for its value proposition in the luxury market.
- Second Generation (as Hyundai Genesis/Genesis G80; 2013–2019): With significant improvements in design, luxury, and technology, this generation saw the transition from the Hyundai Genesis name to the Genesis G80. It solidified its place in the luxury market with accolades for its safety features, comfort, and value.
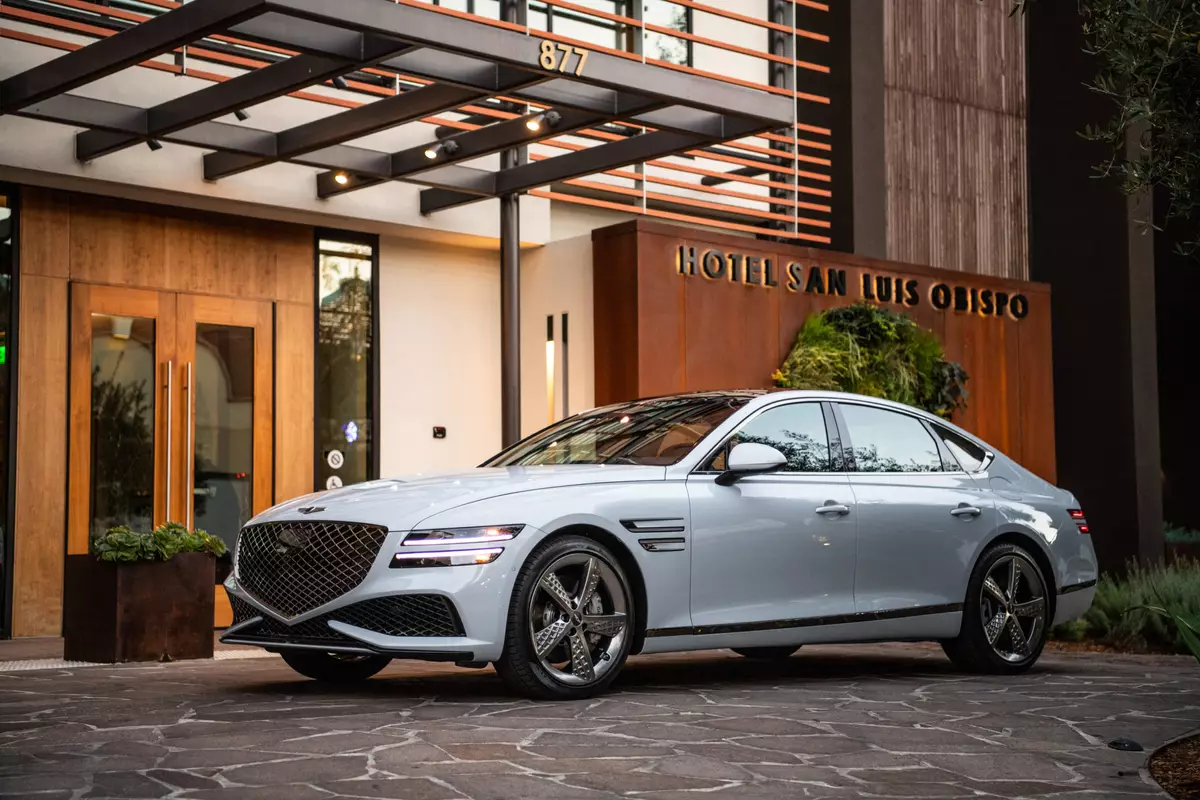
- Third Generation (Genesis G80; 2020-Present): The G80 was fully redesigned, showcasing the brand’s new design language with a bold crest grille and split headlamp/taillight design. This generation offers advanced tech, luxurious interiors, and enhanced driving dynamics.
Genesis G80 Sales Figures
Genesis G80 U.S Sales Data & Charts
US Monthly Sales
US Annual Sales
| Year | Sales Units |
|---|---|
| 2016 | 6,166 |
| 2017 | 16,214 |
| 2018 | 7,446 |
| 2019 | 7,095 |
| 2020 | 3,359 |
| 2021 | 6,031 |
| 2022 | 4,125 |
| 2023 | 5,340 |
| 2024 | 1,072 |
US Annual Growth
Genesis G80 Canada Sales Data & Charts
Canada Annual Sales
| Year | Sales Units |
|---|---|
| 2011 | 8 |
| 2016 | 55 |
| 2017 | 433 |
| 2018 | 393 |
| 2019 | 324 |
| 2020 | 189 |
| 2021 | 277 |
| 2022 | 189 |


