Ford Explorer
Here you will find monthly and yearly Canadian, U.S, Chinese and European market sales figures for the Ford Explorer and its enforcement partner, the Police Interceptor Utility. The Ford Explorer is a midsize SUV that has been one of the best-selling and most recognized SUVs in North America since its introduction. It played a significant role in popularizing the SUV segment during the 1990s and early 2000s.
Ford Explorer Overview
The Ford Explorer was introduced in 1990 as a 1991 model, replacing the smaller Ford Bronco II. Originally, it was built on a truck platform and was available in both two-door and four-door configurations. The Explorer has seen multiple generations, each with notable changes in design, technology, and engineering. Over time, the Explorer transitioned from its truck-based roots to a unibody construction, offering improved ride quality and efficiency.
Historically, the Explorer was offered with V6 and V8 engines. More recent models have incorporated turbocharged four-cylinder and V6 engines under Ford’s EcoBoost line. The Explorer Sport Trac, produced from 2000 to 2010, was a unique variant that combined the features of an SUV with those of a pickup truck, offering a small truck bed.
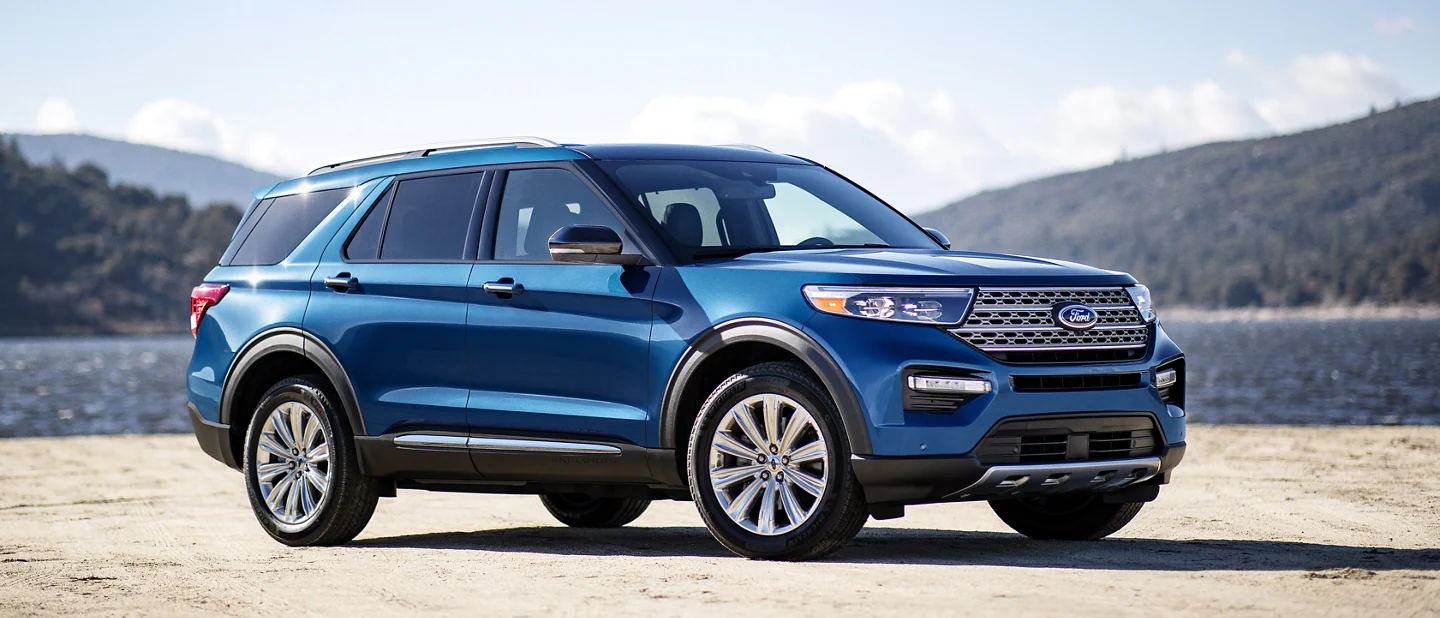
Current versions of the Explorer are equipped with a range of advanced features, including Ford’s SYNC infotainment system, advanced safety features like adaptive cruise control, and terrain management systems for improved off-road capability. The current Explorer is powered by a 3.0L Ecoboost V6 engine that produces 365 horsepower and 380 lb-ft of torque. It is available with a choice of a 10-speed automatic transmission or a 6-speed automatic transmission. The Explorer is available in two body styles: a five-passenger SUV and a seven-passenger SUV. It is also available in a variety of trim levels, including the base XLT, the Limited, the ST-Line, the Timberline, the King Ranch, and the Platinum.
Ford Explorer Sales Figures
Ford Explorer US Sales Data & Charts
US Monthly Sales
US Annual Sales
| Year | Sales Units |
|---|---|
| 2005 | 239,788 |
| 2006 | 179,229 |
| 2007 | 137,817 |
| 2008 | 78,439 |
| 2009 | 52,190 |
| 2010 | 60,687 |
| 2011 | 135,704 |
| 2012 | 174,647 |
| 2013 | 192,397 |
| 2014 | 209,994 |
| 2015 | 249,251 |
| 2016 | 248,507 |
| 2017 | 271,131 |
| 2018 | 261,571 |
| 2019 | 187,061 |
| 2020 | 226,215 |
| 2021 | 219,871 |
| 2022 | 207,763 |
| 2023 | 186,769 |
| 2024 | 58,465 |
US Annual Growth
Ford Explorer Canada Sales Data & Charts
Canada Annual Sales
| Year | Sales Units |
|---|---|
| 2012 | 10,427 |
| 2013 | 10,772 |
| 2014 | 12,677 |
| 2015 | 15,615 |
| 2016 | 15,275 |
| 2017 | 17,283 |
| 2018 | 18,289 |
| 2019 | 9,667 |
| 2020 | 15,283 |
| 2021 | 16,391 |
Canada Annual Growth
Ford Explorer Europe Sales Data & Charts
The seven-seater and four-wheel drive Ford Explorer is only available as a Plug-in Hybrid in Europe. The Explorer PHEV is powered by a 3.0-liter V6 delivering 350hp paired to a 100hp electric motor. Combined output is 450hp and 840 Nm of torque. Thanks to the 13.1 kWh battery pack, the SUV has an EV range of about 40 kilometers. In terms of size, the Explorer is huge for European standards, its length of just over 5 meters is about 13 centimeters longer than a BMW X5 and even longer than a Range Rover.
Europe Annual Sales
| Year | Sales Units |
|---|---|
| 2019 | 212 |
| 2020 | 2,526 |
| 2021 | 4,834 |
| 2022 | 2,314 |
Europe Annual Growth
Ford Explorer China Sales Data & Charts
ince June 2020, the Ford Explorer is produced locally in China by Changan-Ford, together with its platform sibling Lincoln Aviator. Previously, the Explorer was imported into China from North America. Chinese sales of the Explorer started in 2014. Prices range from 309.800 yuan (€37.700,- / US$ 44,300) to 399.800 yuan (€48.700,- / US$ 57,100) which is in line with other 7-seater non-luxury import-brand SUVs like the Buick Enclave (299.900-379.900 yuan) and Volkswagen Teramont (299.900-505.900 yuan), as well as smaller premium SUVs like the Audi Q5L (387.800-498.000 yuan) and BMW X3 (389.900-479.80 yuan). Car sales statistics from China only include domestic production and exclude imported models.
China Annual Sales
| Year | Sales Units |
|---|---|
| 2015 | 10,756 |
| 2016 | 14,178 |
| 2017 | 12,976 |
| 2020 | 21,243 |
| 2021 | 28,586 |
| 2022 | 18,832 |
China Annual Growth
.Ford Explorer Generations
- First generation (1990-1994): The first-generation Explorer was based on the Ford Ranger pickup truck. It was powered by a 4.0L V6 engine that produced 155 horsepower.
- Second generation (1995-2001): The second-generation Explorer was redesigned with a more modern look. It was also larger and more comfortable than the first generation. It was powered by a 4.0L V6 engine that produced 190 horsepower.
- Second generation (1995-2001): The second-generation Explorer was redesigned with a more modern look. It was also larger and more comfortable than the first generation. It was powered by a 4.0L V6 engine that produced 190 horsepower.
- Fourth generation (2006-2010): The fourth-generation Explorer was redesigned with a more car-like interior and exterior. It was also available with a third-row seat for the first time. It was powered by a 4.0L V6 engine that produced 210 horsepower or a 5.4L V8 engine that produced 292 horsepower.
- Fifth generation (2011-2019): The fifth-generation Explorer was redesigned with a more crossover-like look. It was also available with a hybrid powertrain for the first time. It was powered by a 3.5L V6 engine that produced 290 horsepower or a 3.5L V6 hybrid engine that produced 285 horsepower.
- Sixth generation (2020-present): The sixth-generation Explorer was redesigned with a more modern look. It is also available with a more powerful 3.0L Ecoboost V6 engine that produces 365 horsepower.