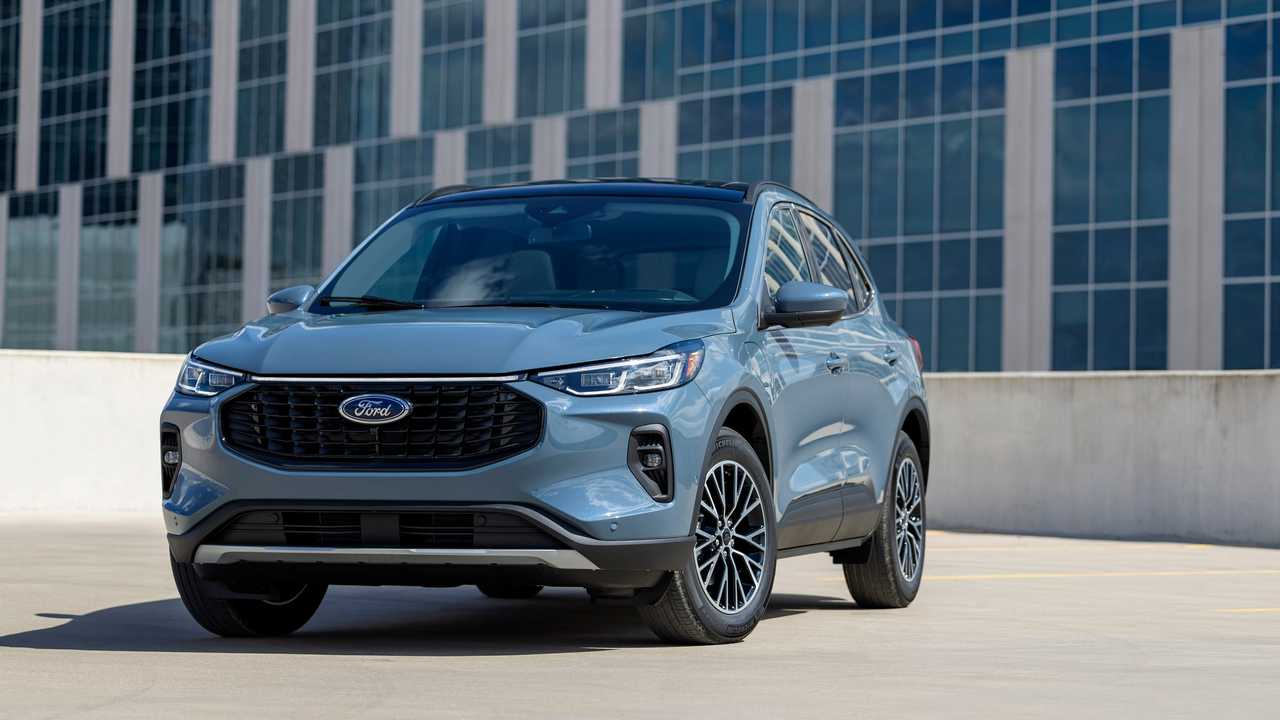
Here you will find monthly and yearly Canadian, U.S and Chinese market sales figures for the Ford Escape. The Ford Escape is a compact crossover SUV produced by the American automaker Ford. Since its introduction, it has been one of Ford’s successful models in the highly competitive compact SUV segment.
Ford Escape Overview
The Ford Escape has played a key role in the compact SUV market, offering a balance of performance, comfort, and practicality. It has evolved over the years to keep up with consumer demands and technology trends. The introduction of hybrid and plug-in hybrid options has further broadened its appeal, aligning with the industry’s shift towards electrification. The Escape continues to be an important model in Ford’s lineup, reflecting the growing preference for SUVs among consumers.


Dec 2001 and Jan 2012 Ford Escape sales show people motivated to buy the last of the classic Escape SUV shape after Ford showed the new 2013 escape.
0% and 2500 cash back helped make my mind up. Happy 2012 Escape owner.
I agree with you. I bought one because I like the look of a truck and after making this SUV for 10 years Ford has it perfected. I would never buy a first year car from any manufacturer. I love my new Escape!!!
Ford's new Escape with those EcoBoost engine options will continue to make it a winner. A 240HP engine in this class with exceptional gas mileage puts Ford ahead of many of it's competitors. The unfortunate thing about the 2013 Escape is that front end….looks like it's already been in an accident.
I drove my mother in law's 2011 Escape Limited with the V6 AWD back to back against a 2013 Escape SEL AWD 2.0 Ecoboost. I then drove a CRV, Equinox, Santa Fe (2012) and Tiguan. We are the very happy owners of the 2013 Escape SEL for reasons too numerous to mention.