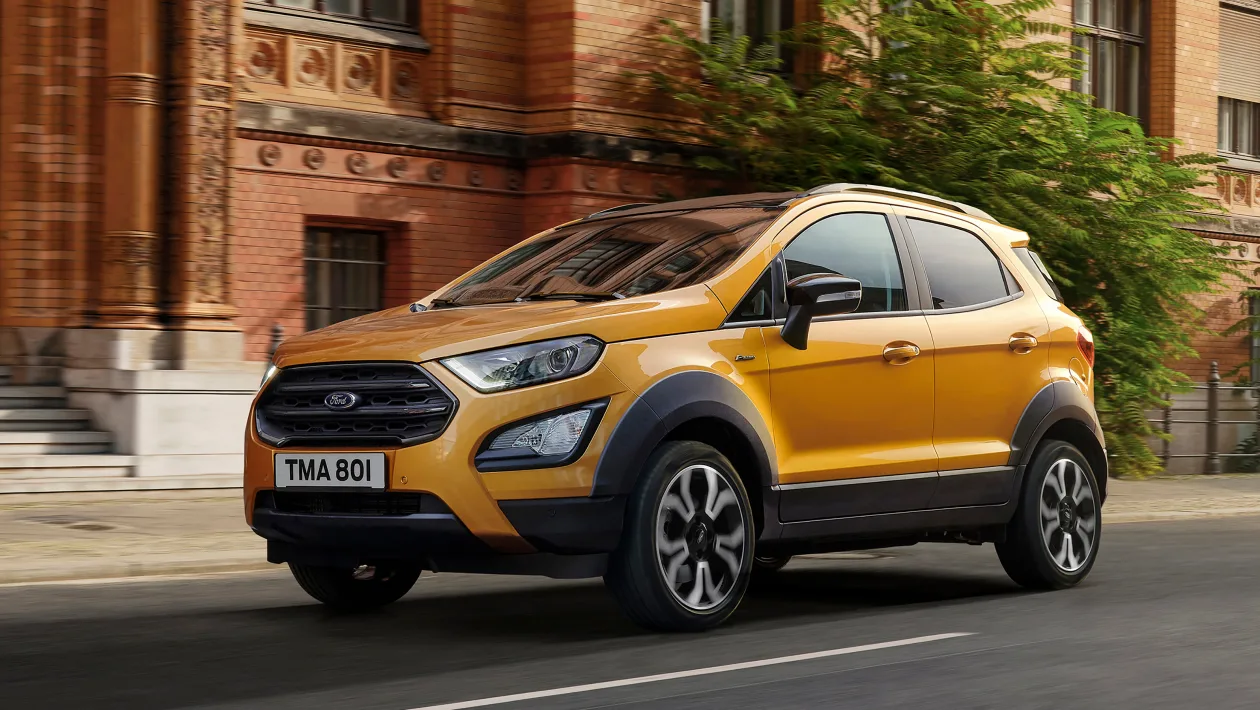
Ford EcoSport
Here you will find monthly and yearly Canadian, European, Chinese and U.S market sales figures for the Ford EcoSport. The Ford EcoSport is a subcompact crossover SUV that was initially introduced for markets in Brazil and other regions in South America in the early 2000s. Over time, it has expanded its presence and has been sold in numerous markets around the world.
Ford EcoSport Overview
The first-generation Ford EcoSport was launched in 2003 and was based on the Ford Fiesta platform. It was primarily designed and developed for the Brazilian market. Recognizing the increasing global demand for compact SUVs, Ford expanded the availability of the EcoSport. The second-generation model, introduced in 2012, was designed with global markets in mind, including Asia, Europe, and later, North America.
The EcoSport has typically combined the agility and fuel economy of a compact car (thanks to its Fiesta underpinnings) with the higher driving position and practicality of an SUV. Over the years, the vehicle has seen various technological and safety updates, keeping it competitive in its segment. Over its production life, the EcoSport has been offered with a range of gasoline and diesel engines, including Ford’s award-winning EcoBoost engines, which aim to provide good fuel efficiency while not compromising on power.
The reception of the EcoSport has been mixed to positive depending on the market. In regions like India, the SUV gained significant popularity. In other markets, it faced stiff competition from other established subcompact SUVs. The subcompact SUV segment has grown rapidly over the past decade, with many automakers introducing their contenders. The EcoSport competes with the likes of the Honda HR-V, Hyundai Kona, Mazda CX-3, and the Chevrolet Trax, among others.
The current EcoSport is powered by a 1.0-liter turbocharged three-cylinder engine that produces 123 horsepower and 125 lb-ft of torque. It is available with a choice of a six-speed automatic transmission or a six-speed manual transmission. The EcoSport is available in two body styles: a five-door hatchback and a four-door SUV. It is also available in a variety of trim levels, including the base S, the SE, and the Titanium. The EcoSport is a good choice for those looking for a small and affordable SUV. It is also relatively fuel-efficient, getting up to 29 mpg in the city and 36 mpg on the highway.
Ford EcoSport Sales Figures
Ford EcoSport U.S Sales Data & Charts
US Monthly Sales
US Annual Sales
| Year | Sales Units |
|---|---|
| 2018 | 54,348 |
| 2019 | 60,599 |
| 2020 | 60,544 |
| 2021 | 40,659 |
| 2022 | 29,193 |
| 2023 | 2,508 |
US Annual Growth
Ford EcoSport Canada Sales Data & Charts
Canada Annual Sales
Year Sales Units
2017
6
2018
6,315
2019
7,438
2020
4,866
2021
2,968
Canada Annual Growth
Ford EcoSport Europe Sales Data & Charts
Europe Annual Sales
| Year | Sales Units |
|---|---|
| 2013 | 59,680 |
| 2014 | 84,643 |
| 2015 | 56,465 |
| 2016 | 42,393 |
| 2017 | 33,792 |
| 2018 | 16,033 |
| 2019 | 2,924 |
| 2020 | 2,670 |
| 2022 | 33,991 |
Europe Annual Growth
Ford EcoSport China Sales Data & Charts
China Annual Sales
| Year | Sales Units |
|---|---|
| 2014 | 12,890 |
| 2015 | 40,084 |
| 2016 | 57,294 |
| 2017 | 63,150 |
| 2018 | 110,574 |
| 2019 | 120,376 |
| 2020 | 47,548 |
| 2021 | 31,081 |