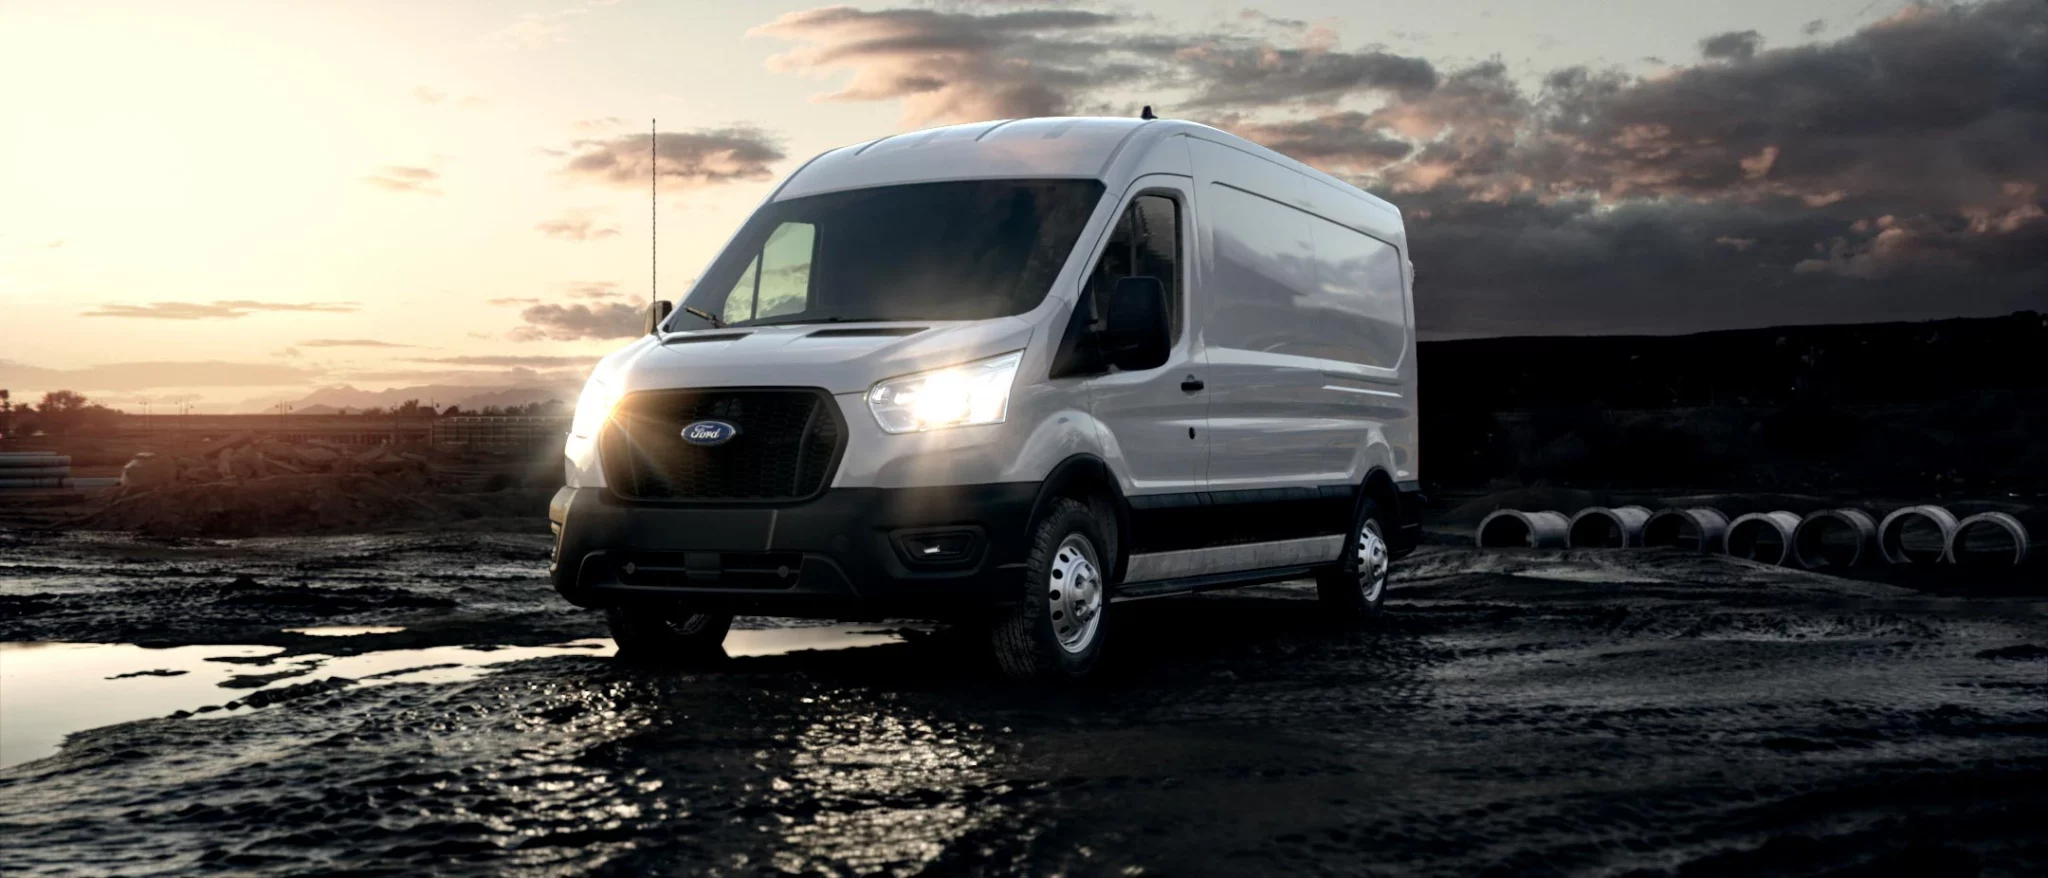
Monthly and annual sales figures for the Ford E-series and Club Wagon in the US.
These statistics include sales of the Ford E-series Club Wagon passenger van as well as those of the commercial van version.
The Ford E-series was replaced by the Ford Transit in 2014.
See how Ford E-series sales compare to the other models in the US Commercial Van segment.
Please note: Ford Motor Company stopped reporting monthly US sales figures in Q3 of 2019 and switched to reporting its US sales quarterly. From Q3 of 2019 onwards you will find Q1 data in the March data field, Q2 data in June, Q3 data in September and Q4 data in December.
FordE-series2016 |
FordE-series2017 |
FordE-series2018 |
FordE-series2019 |
FordE-series2020 |
FordE-series2021 |
FordE-series2022 |
|
January | 2.959 | 3.290 | 5.105 | 2.755 | 3.038 | 3.036 | 2.178 |
February | 3.873 | 4.016 | 3.604 | 3.936 | 3.789 | 3.956 | 3.024 |
March | 5.816 | 4.769 | 5.184 | 4.100 | 3.271 | 3.581 | 1.999 |
April | 5.530 | 5.199 | 3.981 | 4.731 | 1.397 | 2.549 | 1.805 |
May | 3.985 | 5.389 | 3.907 | 3.661 | 1.720 | 2.086 | 1.160 |
June | 5.232 | 4.951 | 3.724 | 3.168 | 2.685 | 2.127 | 2.371 |
July | 4.011 | 3.316 | 3.713 | 2.683 | 2.468 | 2.810 | |
August | 4.716 | 4.894 | 4.020 | 3.306 | 3.437 | 3.978 | |
September | 4.073 | 4.810 | 3.311 | 9.875 | 3.297 | 3.227 | 2.898 |
October | 4.592 | 4.265 | 3.901 | 4.910 | 4.469 | 4.078 | 3.692 |
November | 4.705 | 4.494 | 4.337 | 3.736 | 3.412 | 2.771 | 2.982 |
December | 4.753 | 3.911 | 3.149 | 4.191 | 3.934 | 3.806 |
FordE-series |
|
2021 | 37.122 |
2020 | 37.001 |
2019 | 45.063 |
2018 | 47.936 |
2017 | 53.304 |
2016 | 54.245 |
2015 | 50.788 |
2014 | 103.263 |
2013 | 125.356 |
2012 | 122.423 |
2011 | 116.874 |
2010 | 108.258 |
2009 | 85.735 |
2008 | 124.596 |
2007 | 168.722 |
2006 | 180.457 |
2005 | 179.543 |
2004 | 171.018 |
2003 | 161.721 |
2002 | 165.085 |
2001 | 159.565 |
2000 | 187.027 |
1999 | 202.024 |
1998 | 206.026 |
1997 | 186.690 |
1996 | 176.480 |
1995 | 195.035 |
Use the dropdown at the top right of this page to find sales figures for any other car model sold in the US since the early 2000’s.
Sources: Manufacturers, ANDC
FordE-series2016 |
FordE-series2017 |
FordE-series2018 |
FordE-series2019 |
FordE-series2020 |
FordE-series2021 |
FordE-series2022 |
|
January | 2.959 | 3.290 | 5.105 | 2.755 | 3.038 | 3.036 | 2.178 |
February | 3.873 | 4.016 | 3.604 | 3.936 | 3.789 | 3.956 | 3.024 |
March | 5.816 | 4.769 | 5.184 | 4.100 | 3.271 | 3.581 | 1.999 |
April | 5.530 | 5.199 | 3.981 | 4.731 | 1.397 | 2.549 | 1.805 |
May | 3.985 | 5.389 | 3.907 | 3.661 | 1.720 | 2.086 | 1.160 |
June | 5.232 | 4.951 | 3.724 | 3.168 | 2.685 | 2.127 | 2.371 |
July | 4.011 | 3.316 | 3.713 | 2.683 | 2.468 | 2.810 | |
August | 4.716 | 4.894 | 4.020 | 3.306 | 3.437 | 3.978 | |
September | 4.073 | 4.810 | 3.311 | 9.875 | 3.297 | 3.227 | 2.898 |
October | 4.592 | 4.265 | 3.901 | 4.910 | 4.469 | 4.078 | 3.692 |
November | 4.705 | 4.494 | 4.337 | 3.736 | 3.412 | 2.771 | 2.982 |
December | 4.753 | 3.911 | 3.149 | 4.191 | 3.934 | 3.806 |
FordE-series |
|
2021 | 37.122 |
2020 | 37.001 |
2019 | 45.063 |
2018 | 47.936 |
2017 | 53.304 |
2016 | 54.245 |
2015 | 50.788 |
2014 | 103.263 |
2013 | 125.356 |
2012 | 122.423 |
2011 | 116.874 |
2010 | 108.258 |
2009 | 85.735 |
2008 | 124.596 |
2007 | 168.722 |
2006 | 180.457 |
2005 | 179.543 |
2004 | 171.018 |
2003 | 161.721 |
2002 | 165.085 |
2001 | 159.565 |
2000 | 187.027 |
1999 | 202.024 |
1998 | 206.026 |
1997 | 186.690 |
1996 | 176.480 |
1995 | 195.035 |