
Daewoo Sales Data, Trends & Analysis for the U.S Automotive Market
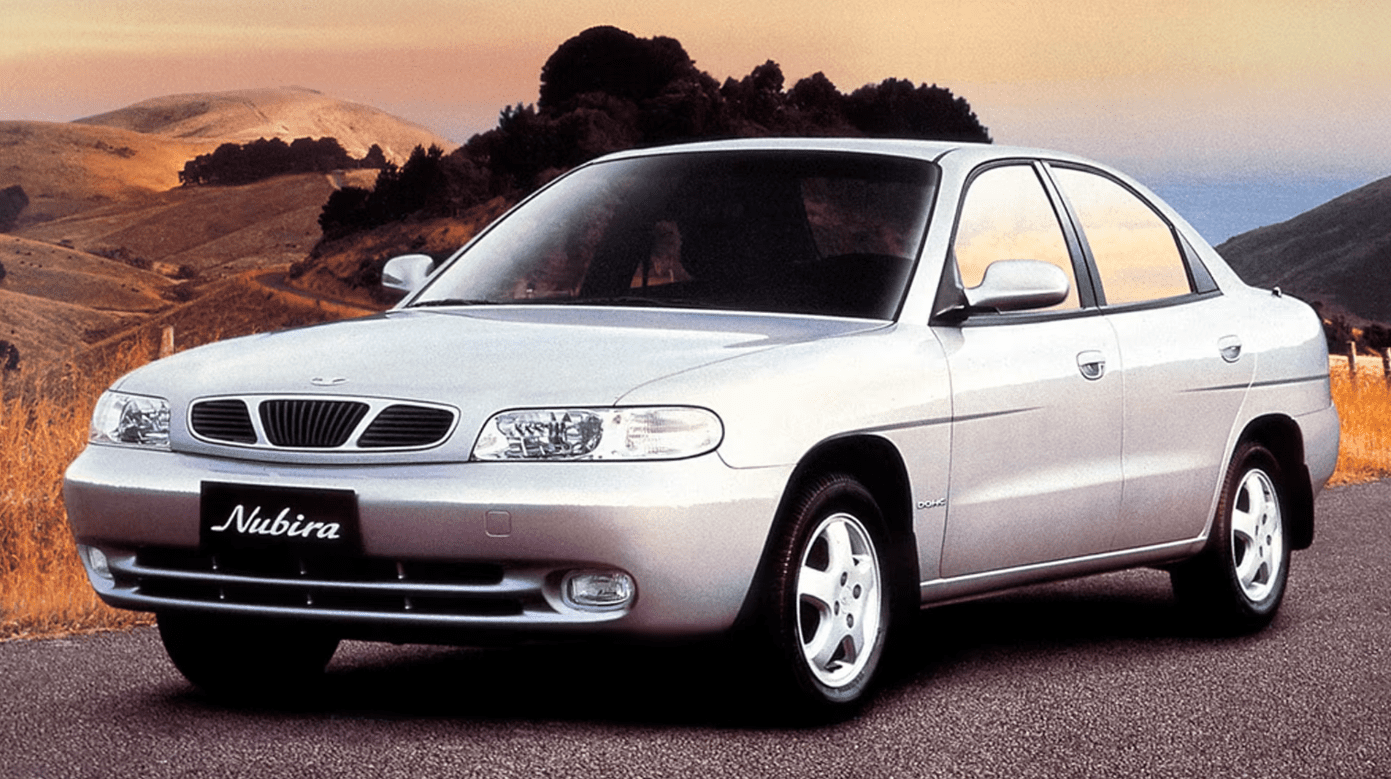
Daewoo entered the US car market in 1997 as the third South-Korean car maker, behind Hyundai (1986) and Kia (1993). The brand was moderately successful, selling almost 70,000 vehicles in its third year on the market, which was better than Kia did in its first few years. Three models were available from the start: the Lanos subcompact hatchback and sedan, the Nubira compact sedan, station wagon and hatchback, and the Leganza midsized sedan.
Daewoo U.S Sales Figures & Highlights
Daewoo brand car sales ended in 2002 when the company went bankrupt and was acquired by General Motors. The successors of the Nubira and Leganza were sold in the US by Suzuki, as the Reno/Forenza and the Verona, but their shoddy reliability hurt Suzuki’s image and contributed to the demise of the brand in the US.
The new company GM Daewoo continued to supply its South-Korean developed and produced small and compact models to Chevrolet, Pontiac and Buick for sales in the United States, Europe and other markets. For example the Buick Encore and Chevrolet Trax, Pontiac G3, Chevrolet Spark, Sonic, Cruze, Captiva Sport and Aveo for the US market were developed by GM Daewoo and some even produced in South-Korea.
Daewoo Annual Sales, Growth and Market Share in the United States
Below we have a table that shows total Daewoo sales volumes for the U.S automotive market, broken out by year since 2005. This data captures all Daewoo vehicle sales for the entire U.S automotive market.
| Year | Sales | YOY Change | Marketshare | Marketshare Change |
|---|---|---|---|---|
| 1997 | 5,272 | 0.00 | 0.18 | 0.00 |
| 1998 | 12,238 | 132.13 | 0.39 | 53.69 |
| 1999 | 30,066 | 145.68 | 1.01 | 61.36 |
| 2000 | 52,502 | 74.62 | 1.87 | 45.84 |
| 2001 | 36,471 | -30.53 | 1.60 | -16.81 |
| 2002 | 13,095 | -64.09 | 0.55 | -191.24 |
| 2003 | 327 | -97.50 | 0.02 | -3,305.64 |
| 2004 | 0 | -100.00 | 0.00 | 0.00 |
| 2005 | 0 | 0.00 | 0.00 | 0.00 |
| 2006 | 0 | 0.00 | 0.00 | 0.00 |
| 2007 | 0 | 0.00 | 0.00 | 0.00 |
| 2008 | 0 | 0.00 | 0.00 | 0.00 |
| 2009 | 0 | 0.00 | 0.00 | 0.00 |
| 2010 | 0 | 0.00 | 0.00 | 0.00 |
| 2011 | 0 | 0.00 | 0.00 | 0.00 |
| 2012 | 0 | 0.00 | 0.00 | 0.00 |
| 2013 | 0 | 0.00 | 0.00 | 0.00 |
| 2014 | 0 | 0.00 | 0.00 | 0.00 |
| 2015 | 0 | 0.00 | 0.00 | 0.00 |
| 2016 | 0 | 0.00 | 0.00 | 0.00 |
| 2017 | 0 | 0.00 | 0.00 | 0.00 |
| 2018 | 0 | 0.00 | 0.00 | 0.00 |
| 2019 | 0 | 0.00 | 0.00 | 0.00 |
| 2020 | 0 | 0.00 | 0.00 | 0.00 |
| 2021 | 0 | 0.00 | 0.00 | 0.00 |
| 2022 | 0 | 0.00 | 0.00 | 0.00 |
| 2023 | 0 | 0.00 | 0.00 | 0.00 |
| 2024 | 0 | 0.00 | 0.00 | 0.00 |
Daewoo U.S Annual Sales Units & Growth Chart
Below is a visual representation of Daewoo’s United States sales units over time. We have both the Daewoo sales units and the market share in the U.S market. Click on the items in the legend to see each series by itself.
Daewoo U.S Growth Rate & Market Share Chart
Below is the annual growth rate for the Daewoo brand in the United States, shown against the Daewoo’s marketshare changes in the U.S. This gives you a good look into how Daewoo has faired against the other brands in terms of absolute sales and effect on marketshare. Click on the items in the legend to see each series by itself.
The Best-Selling Daewoo Cars & SUVs in the U.S
Coming Soon


