
Chrysler 200
Here you will find sales figures for the Chrysler 200. The Chrysler 200 was a mid-size sedan produced by Chrysler, a division of Stellantis. It was introduced in 2010 and was in production until 2017. During its run, the Chrysler 200 underwent significant redesigns and offered a blend of style, comfort, and affordability.
Chrysler 200 Overview
The Chrysler 200 was a mid-size sedan that was produced by Chrysler from 2011 to 2017. It was available in four trim levels: LX, Touring, Limited, and S. The Chrysler 200 was powered by a 2.4L four-cylinder engine that produced 173 horsepower and 166 lb-ft of torque, or a 3.6L V6 engine that produced 283 horsepower and 260 lb-ft of torque. It was mated to a six-speed automatic transmission. The Chrysler 200 was discontinued in 2017 due to declining sales. It was replaced by the Chrysler Airflow. The Chrysler 200 was known for its comfortable ride and spacious interior. It also had a long list of standard features, including a touchscreen infotainment system, a rearview camera, and Bluetooth connectivity.
Chrysler 200 Sales Figures
The Chrysler 200 represented a significant step forward for the brand in the competitive mid-size sedan market. While it had its strong points, particularly in terms of design and comfort, it faced tough competition from rivals that often overshadowed it in areas like performance, fuel economy, and interior space. Production of the Chrysler 200 ended in 2017, as the market trend shifted towards SUVs and crossovers, and the brand chose to focus on other segments. The Chrysler 200 was discontinued in 2017 due to declining sales. It was replaced by the Chrysler Airflow.
Chrysler 200 U.S Sales Data & Charts
US Annual Sales
| Year | Sales Units |
|---|---|
| 2011 | 86,987 |
| 2012 | 135,193 |
| 2013 | 122,480 |
| 2014 | 117,363 |
| 2015 | 177,889 |
| 2016 | 62,185 |
| 2017 | 18,457 |
| 2018 | 1,043 |
| 2019 | 48 |
| 2020 | 9 |
| 2021 | 15 |
| 2022 | 3 |
| 2023 | 3 |
US Annual Growth
Chrysler 200 Canada Sales Data & Charts
Canada Annual Sales
| Year | Sales Units |
|---|---|
| 2012 | 14,125 |
| 2013 | 11,666 |
| 2014 | 11,655 |
| 2015 | 10,961 |
| 2016 | 7,010 |
| 2017 | 2,842 |
| 2018 | 0 |
| 2019 | 1 |
Canada Annual Growth
Chrysler 200 Generations
First Generation (2011–2014)
The first generation Chrysler 200 was introduced in 2011 as a replacement for the Chrysler Sebring. It was available in four trim levels: LX, Touring, Limited, and S. It featured a 2.4L four-cylinder engine that produced 173 horsepower and 166 lb-ft of torque, or a 3.6L V6 engine that produced 283 horsepower and 260 lb-ft of torque. It was mated to a six-speed automatic transmission.
- Introduction: Launched as a replacement for the Chrysler Sebring, with improved styling and features.
- Engines: Options included a 2.4L four-cylinder and a 3.6L V6 engine, paired with a 4-speed, 6-speed, or a CVT transmission.
- Trim Levels: Various trim levels provided options ranging from basic to more luxurious amenities.
- Convertible Option: A convertible variant was available, offering a choice between a soft-top or retractable hardtop.
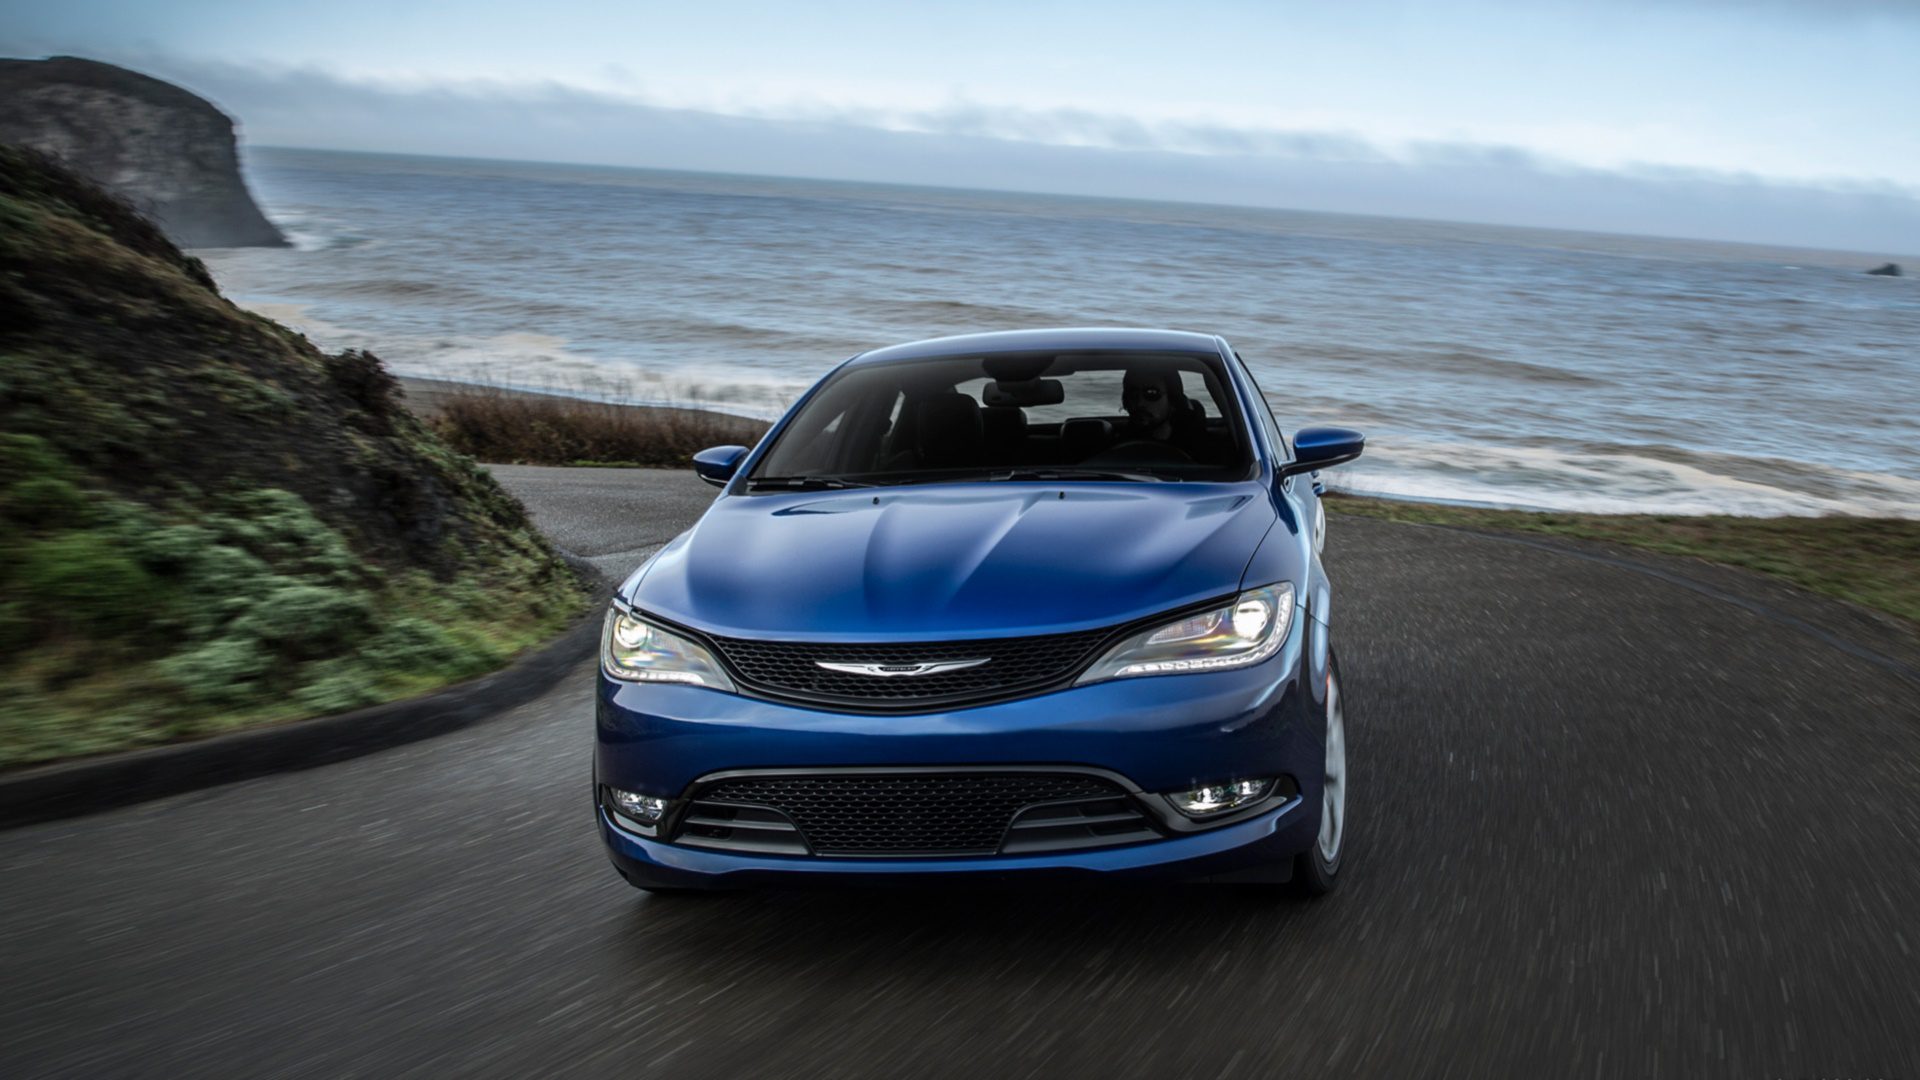
Second Generation (2015–2017)
The second generation Chrysler 200 was introduced in 2015 as a mid-cycle refresh of the first generation truck. It received a new front fascia, new taillights, and a new interior. It was still available in four trim levels: LX, Touring, Limited, and S. The second generation 200 also received a new 2.4L Tigershark four-cylinder engine that produced 184 horsepower and 173 lb-ft of torque.
- Redesign: A complete overhaul in 2015 brought a more modern and upscale design.
- Engines: Continued with updated versions of the 2.4L four-cylinder and 3.6L V6 engines, mated to a 9-speed automatic transmission.
- Interior Quality: Improved interior quality with a well-designed cabin, more comfortable seats, and enhanced materials.
- Technology: Equipped with Chrysler’s Uconnect infotainment system and available advanced safety features such as adaptive cruise control, blind-spot monitoring, and forward-collision warning.
- All-Wheel Drive: An available all-wheel-drive system with the V6 engine provided better traction and performance.
Notes
Through 2009 the 200’s sales are actually the sales of its predecessor, the Sebring. From December 2010 forwards, sales included the Sebring before switching to 200 sales only.


