
Chevrolet Trax
Here you will find monthly and yearly Canadian, European, Chinese and U.S. sales figures for the Chevrolet Trax, which went on sale in Canada in December 2012. The Chevrolet Trax is a subcompact crossover SUV produced by Chevrolet, a division of General Motors. The Trax was designed to meet the growing demand for small SUVs, particularly in urban environments where space is at a premium but the versatility of an SUV is desired.
Chevrolet Trax Overview
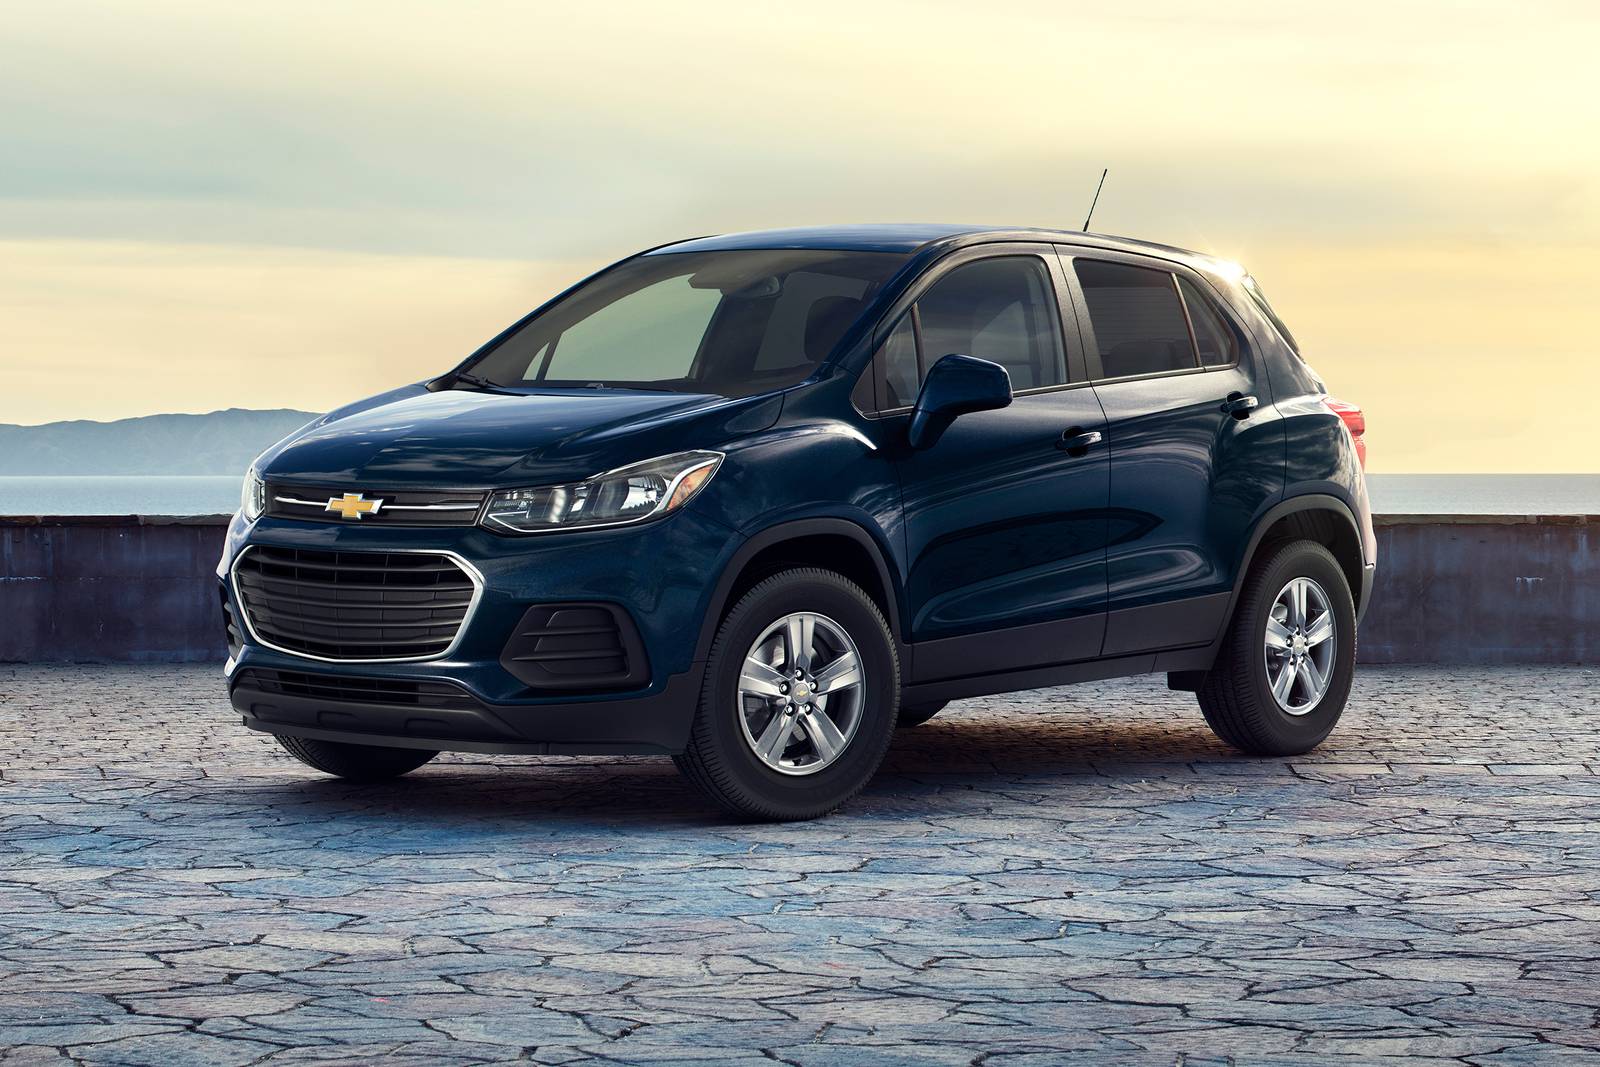
The Chevrolet Trax made its global debut in 2012 and went on sale in various markets in 2013. As a subcompact crossover, the Trax offers a higher driving position than a typical hatchback, but its compact dimensions make it maneuverable in city environments. Its design has evolved over the years, keeping in step with Chevrolet’s global design language.
The Trax’s interior is designed to be functional and versatile, with a focus on connectivity. Many models come equipped with Chevrolet’s infotainment system, which includes touchscreen interfaces and smartphone integration. While the base models are more utilitarian, higher trims offer more comfort features and advanced tech.
The Chevrolet Trax is sold in various markets around the world. Depending on the region, it may have different engine options or features. In some regions, the Trax has close siblings or is nearly identical to other GM products. For instance, the Buick Encore is a close relative of the Trax.
The current generation Trax is available with a choice of one engine: a 1.4L turbocharged four-cylinder engine that produces 138 horsepower and 148 lb-ft of torque. It is available with a six-speed automatic transmission. The Trax is known for its fuel efficiency. It gets an EPA-estimated 25 mpg in the city and 31 mpg on the highway. The Trax is also known for its affordability. It starts at $22,300, which is one of the lowest starting prices in the subcompact SUV class.
The Trax comes standard with a variety of features, including a 7-inch touchscreen infotainment system, a rearview camera, and Bluetooth connectivity. Available features include a 6-speaker sound system, a sunroof, and a heated steering wheel. The Trax is a good choice for those looking for a fuel-efficient and affordable subcompact SUV. It is also a good choice for those who are looking for a car with a small footprint and easy to park.
Chevrolet Trax Sales Figures
The Chevrolet Trax has generally been well-received for its combination of compact size and SUV versatility. Its affordability and efficiency are also strong points. However, like many vehicles in its segment, it may face critiques for things like cabin noise or driving dynamics when compared to larger, more premium SUVs.
Chevrolet Trax U.S Sales Data & Charts
US Monthly Sales
US Annual Sales
| Year | Sales Units |
|---|---|
| 2014 | 739 |
| 2015 | 63,030 |
| 2016 | 79,016 |
| 2017 | 79,289 |
| 2018 | 89,917 |
| 2019 | 116,817 |
| 2020 | 106,299 |
| 2021 | 42,590 |
| 2022 | 26,598 |
| 2023 | 109,383 |
| 2024 | 37,587 |
US Annual Growth
Chevrolet Trax Canada Sales Data & Charts
Canada Annual Sales
Year Sales Units
2012
27
2013
7,013
2014
8,533
2015
8,156
2016
9,072
2017
5,965
2018
4,465
2019
5,298
2020
3,887
2021
2,392
Canada Annual Growth
Chevrolet Trax Europe Sales Data & Charts
Europe Annual Sales
| Year | Sales Units |
|---|---|
| 2014 | 43,682 |
| 2015 | 50,736 |
| 2016 | 37,636 |
| 2017 | 17,290 |
| 2018 | 6,346 |
| 2019 | 462 |
Europe Annual Growth
Chevrolet Trax China Sales Data & Charts
The Trax was replaced in 2019 by the Chevrolet Tracker.
China Annual Sales
| Year | Sales Units |
|---|---|
| 2012 | 27 |
| 2013 | 7,013 |
| 2014 | 8,533 |
| 2015 | 8,156 |
| 2016 | 9,072 |
| 2017 | 5,965 |
| 2018 | 4,465 |
| 2019 | 5,298 |
| 2020 | 3,887 |
| 2021 | 2,392 |


