
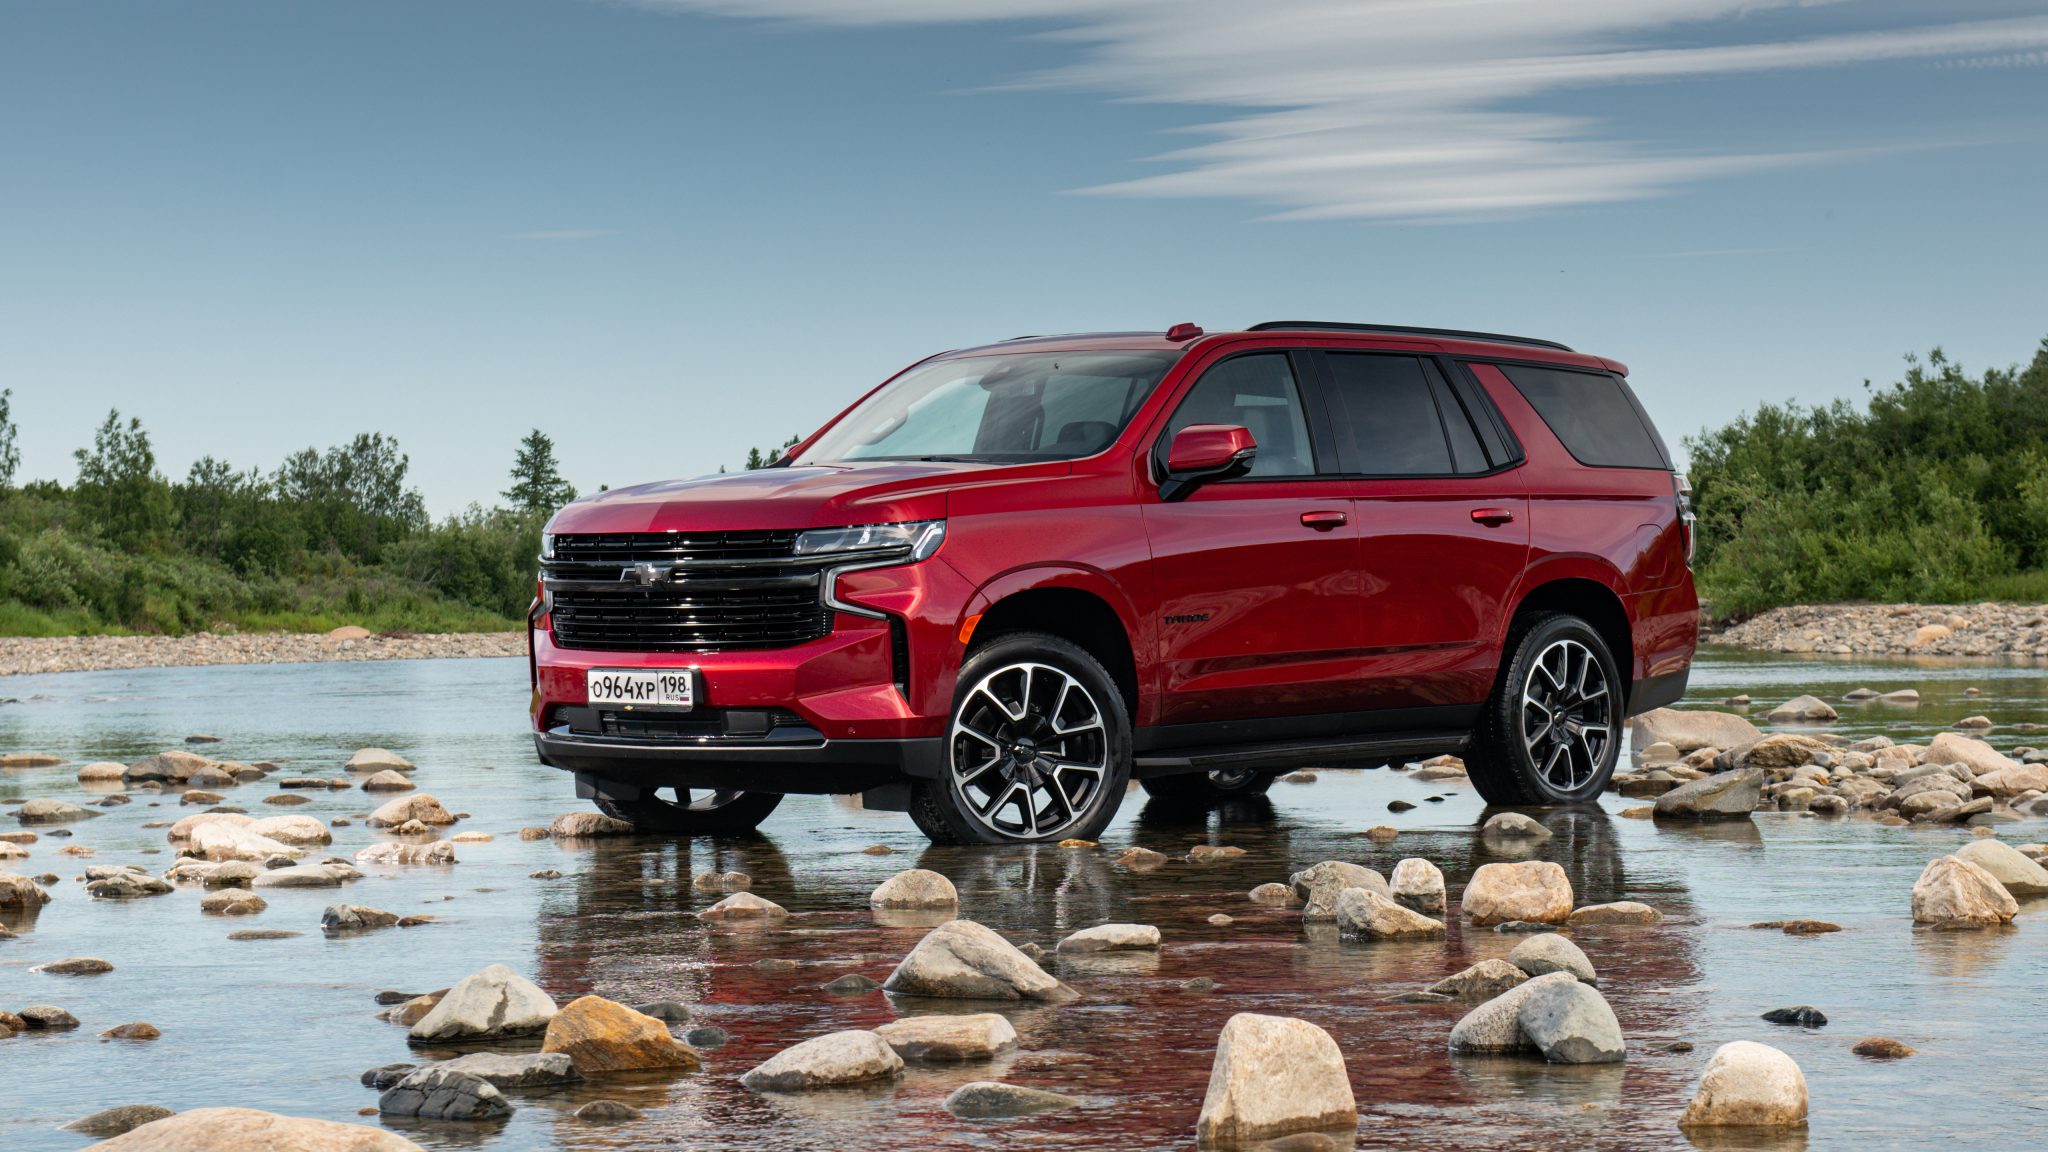
Chevrolet Tahoe
Here you will find sales figures for the Chevrolet Tahoe. The Chevrolet Tahoe is a full-size SUV produced by General Motors under the Chevrolet brand. Known for its spacious interior, robust performance, and towing capability, it has been a popular choice among families and those in need of a versatile, large vehicle. The Chevrolet Tahoe is a popular full-size SUV that has been praised for its power, capability, and durability. It is a good choice for people who are looking for an SUV that can handle both work and play.
Chevrolet Tahoe Overview
The Chevrolet Tahoe is a full-size SUV that has been in production since 1995. It is currently in its fifth generation, which was introduced in 2021. The Tahoe is available in two wheelbase lengths: standard wheelbase and extended wheelbase. It is available in three trim levels: LS, LT, and High Country. The Chevrolet Tahoe has been praised for its spacious interior, strong performance, and towing capabilities. Its ability to accommodate up to nine passengers, along with ample cargo space, makes it a favorable choice for large families. However, some critics point to its sizable exterior dimensions that can make it challenging to maneuver in tight spaces. The transition to an independent rear suspension in the latest generation has addressed some ride quality concerns from previous generations.
The Tahoe is powered by a 6.2L V8 engine that produces 420 horsepower and 460 lb-ft of torque. It is mated to a 10-speed automatic transmission. The Tahoe is available with rear-wheel drive or four-wheel drive. The Tahoe gets an EPA-estimated 16 mpg in the city and 23 mpg on the highway. It is not the most fuel-efficient full-size SUV on the market, but it is still respectable for a car of its size and power. The Tahoe is not the most spacious full-size SUV on the market, but it is comfortable for up to nine adults. The cargo space is also decent, with 15.3 cubic feet of space behind the third row of seats and 94.7 cubic feet of space with the third row of seats folded down.
Chevrolet Tahoe Sales Figures
The Chevrolet Tahoe continues to be a prominent player in the full-size SUV segment, offering a blend of traditional SUV capabilities with modern comfort and technology. It’s a suitable vehicle for those who need generous passenger and cargo space, towing abilities, and off-road prowess. The continuous updates and improvements ensure that the Tahoe remains competitive and aligned with the evolving needs and preferences of consumers, which is shown in the strong sales figures each and every year.
Chevrolet Tahoe U.S Sales Data & Charts
US Monthly Sales
US Annual Sales
| Year | Sales Units |
|---|---|
| 2005 | 152,305 |
| 2006 | 161,491 |
| 2007 | 146,256 |
| 2008 | 91,578 |
| 2009 | 73,254 |
| 2010 | 75,675 |
| 2011 | 80,527 |
| 2012 | 73,116 |
| 2013 | 83,502 |
| 2014 | 97,726 |
| 2015 | 88,342 |
| 2016 | 103,306 |
| 2017 | 98,961 |
| 2018 | 104,152 |
| 2019 | 101,189 |
| 2020 | 88,237 |
| 2021 | 106,019 |
| 2022 | 105,754 |
| 2023 | 110,326 |
| 2024 | 23,323 |
US Annual Growth
Chevrolet Tahoe Canada Sales Data & Charts
Canada Annual Sales
| Year | Sales Units |
|---|---|
| 2012 | 1,108 |
| 2013 | 1,632 |
| 2014 | 1,779 |
| 2015 | 2,364 |
| 2016 | 3,062 |
| 2017 | 3,110 |
| 2018 | 3,576 |
| 2019 | 3,562 |
| 2020 | 2,625 |
| 2021 | 4,590 |
Canada Annual Growth
Chevrolet Tahoe Generations
First Generation (1995–1999)
The first generation Tahoe was introduced in 1995 as a replacement for the Chevrolet Suburban. It was available in two wheelbase lengths: standard wheelbase and extended wheelbase. It was available in three trim levels: LS, LT, and Z71. It launched as the successor to the Chevrolet K5 Blazer, providing more modern styling and features. It was offered V8 engines, focused on strong performance.
Second Generation (2000–2006)
The second generation Tahoe was introduced in 2000 as a mid-cycle refresh of the first generation truck. It received a new front fascia, new taillights, and a new interior. It was available in the same two wheelbase lengths and trim levels as the first generation truck. Introduced a more refined design and improved interior comfort. Continued to offer powerful V8 engines, enhancing towing and off-road abilities. Added features like stability control became available.
Third Generation (2007–2014)
The third generation Tahoe was introduced in 2007 as a complete redesign of the second generation truck. It was available in the same two wheelbase lengths and trim levels as the second generation truck. The third generation Tahoe also received a new V8 engine that produced more power and torque than the previous engine. It was built on the GMT900 platform, improving handling and ride comfort. Included more luxurious materials and technology features. Introduced engines with Active Fuel Management to improve fuel economy.
Fourth Generation (2015–2020)
The Tahoe got a more modern exterior and interior design, with improvements in materials and features. Inside was an upgraded infotainment system, connectivity options, and more advanced safety features. Power wise, the Tahoe continued with powerful V8 options and more efficient transmission.
Fifth Generation (2021–Present)
The fifth generation Tahoe was introduced in 2021 as a complete redesign of the third generation truck. It is available in the same two wheelbase lengths as the third generation truck, but it is only available in two trim levels: LT and High Country. The fourth generation Tahoe also received a new interior and exterior design, as well as a new suspension system that improves ride quality and handling. It is built on GM’s new T1 platform, significantly improving ride quality and handling. That new suspension was in fact a fully independent rear suspension for improved comfort. Inside there are high-quality materials, larger touchscreens, and more advanced technology features.


