
Chevrolet Express
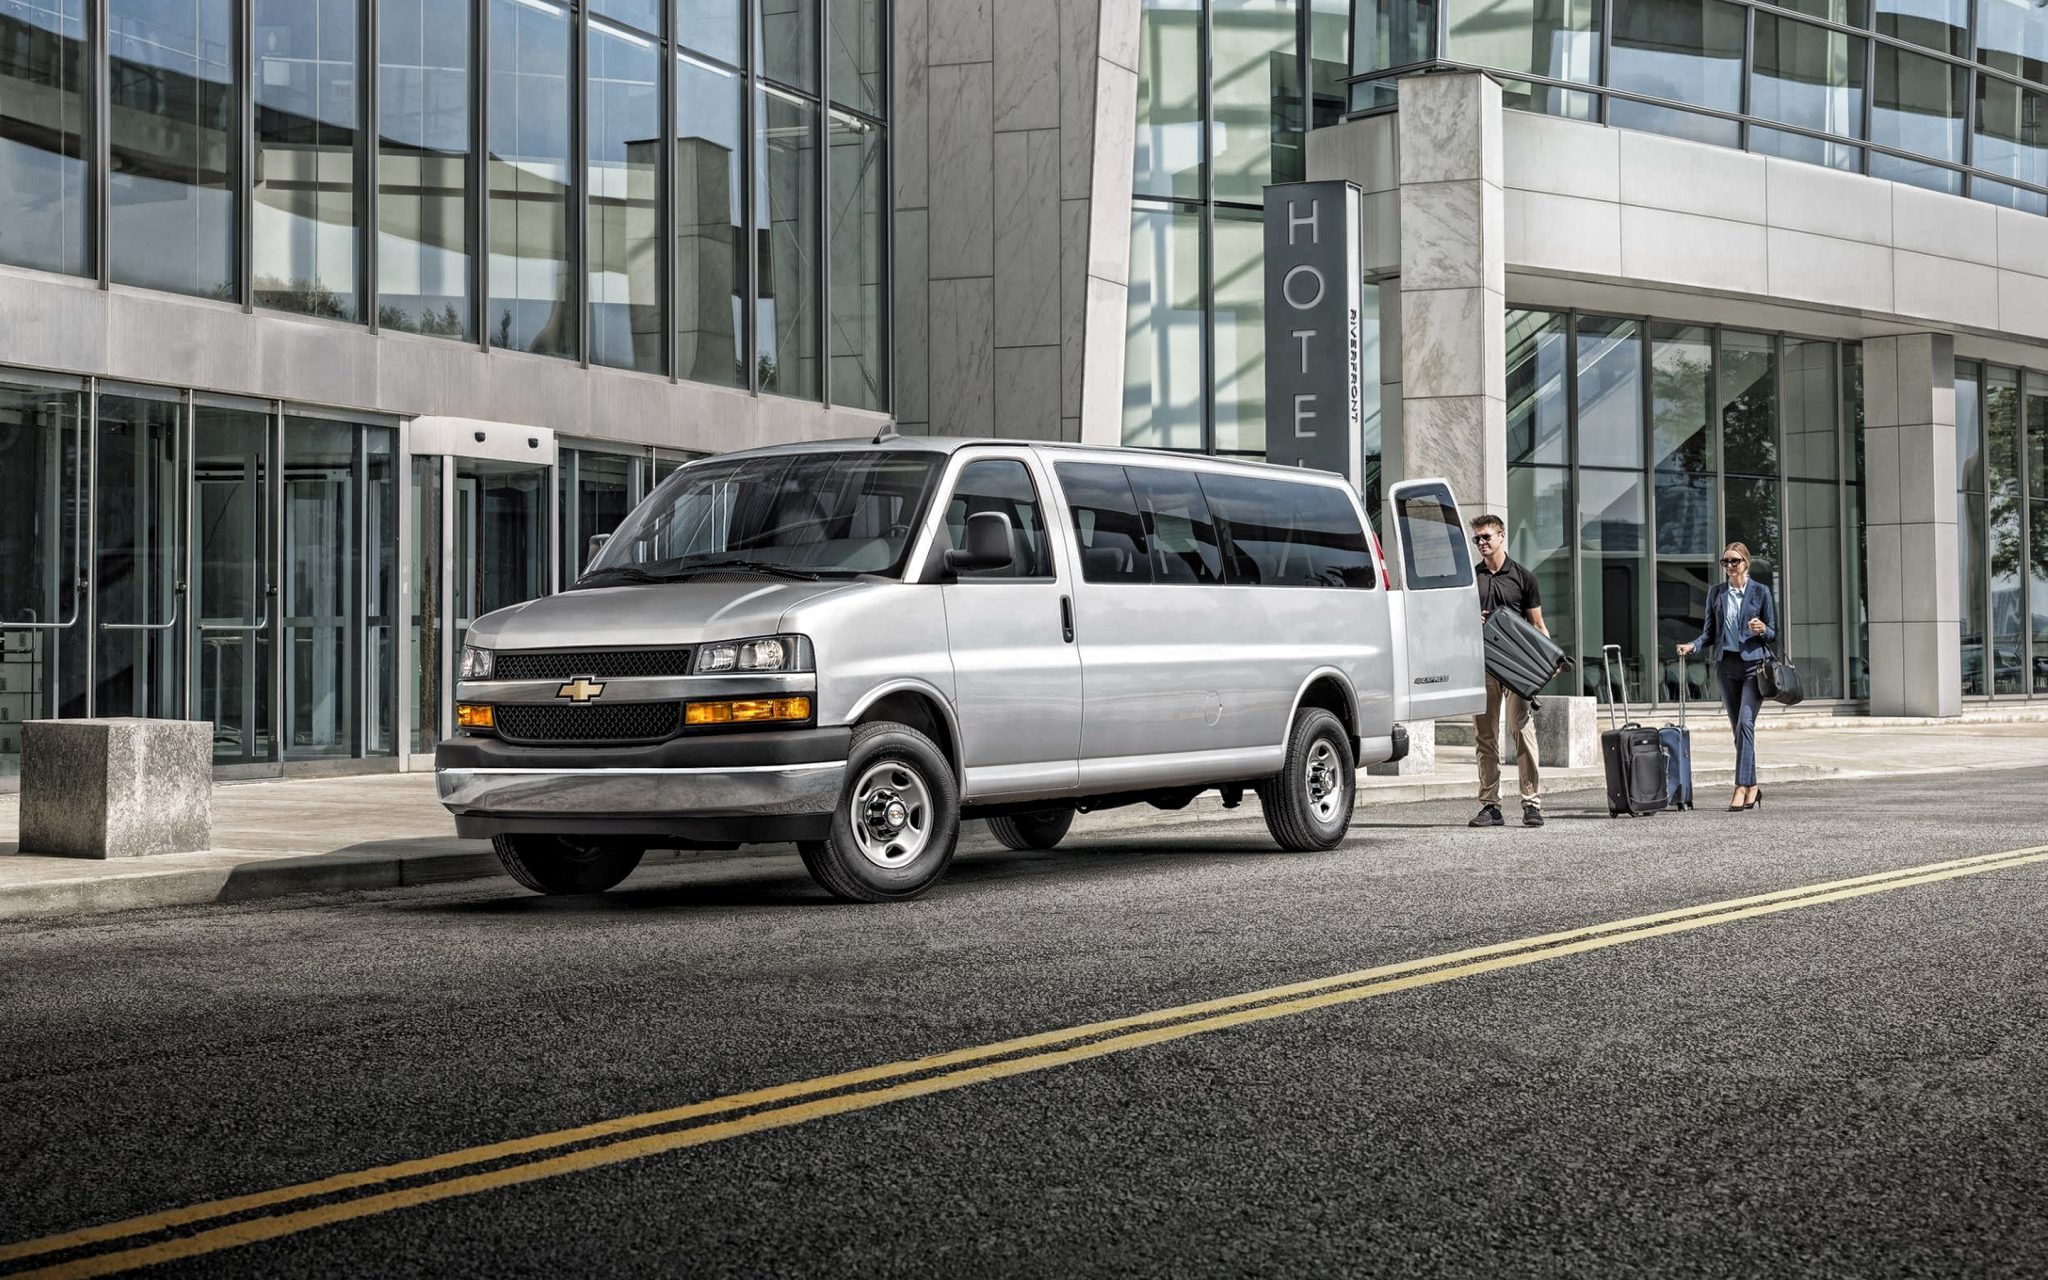
Here you will find sales figures for the Chevrolet Express. The Chevrolet Express is a full-size van that was introduced in 1996. It is currently in its fourth generation, which was introduced in 2014. The Express is available in two wheelbase lengths: standard wheelbase and extended wheelbase. It is available in three trim levels: LS, LT, and LT Z71.
The Express is powered by a 4.3L V6 engine that produces 277 horsepower and 291 lb-ft of torque. It is mated to a six-speed automatic transmission. The Express is available with rear-wheel drive or four-wheel drive. The Express gets an EPA-estimated 16 mpg in the city and 23 mpg on the highway. It is not the most fuel-efficient full-size van on the market, but it is still respectable for a van of its size.
The Express is not the most spacious full-size van on the market, but it is comfortable for up to 15 passengers. The cargo space is also decent, with 46.4 cubic feet of space behind the rear seats and 139.9 cubic feet of space with the rear seats folded down. The Chevrolet Express is a popular full-size van that has been praised for its durability, reliability, and cargo capacity. It is a good choice for people who are looking for a van that can handle both work and play.
Chevrolet Express Sales Figures
Chevrolet Express U.S Sales Data & Charts
US Monthly Sales
US Annual Sales
| Year | Sales Units |
|---|---|
| 2005 | 128,585 |
| 2006 | 123,195 |
| 2007 | 114,730 |
| 2008 | 86,986 |
| 2009 | 54,293 |
| 2010 | 59,753 |
| 2011 | 71,943 |
| 2012 | 81,885 |
| 2013 | 79,087 |
| 2014 | 79,352 |
| 2015 | 63,382 |
| 2016 | 68,007 |
| 2017 | 69,164 |
| 2018 | 66,963 |
| 2019 | 77,457 |
| 2020 | 55,040 |
| 2021 | 44,357 |
| 2022 | 52,796 |
| 2023 | 40,659 |
| 2024 | 7,502 |
US Annual Growth
Chevrolet Express Canada Sales Data & Charts
Canada Annual Sales
| Year | Sales Units |
|---|---|
| 2012 | 5,077 |
| 2013 | 4,642 |
| 2014 | 4,676 |
| 2015 | 3,061 |
| 2016 | 4,164 |
| 2017 | 4,671 |
| 2018 | 4,705 |
| 2019 | 4,102 |
| 2020 | 2,768 |
| 2021 | 1,813 |


