
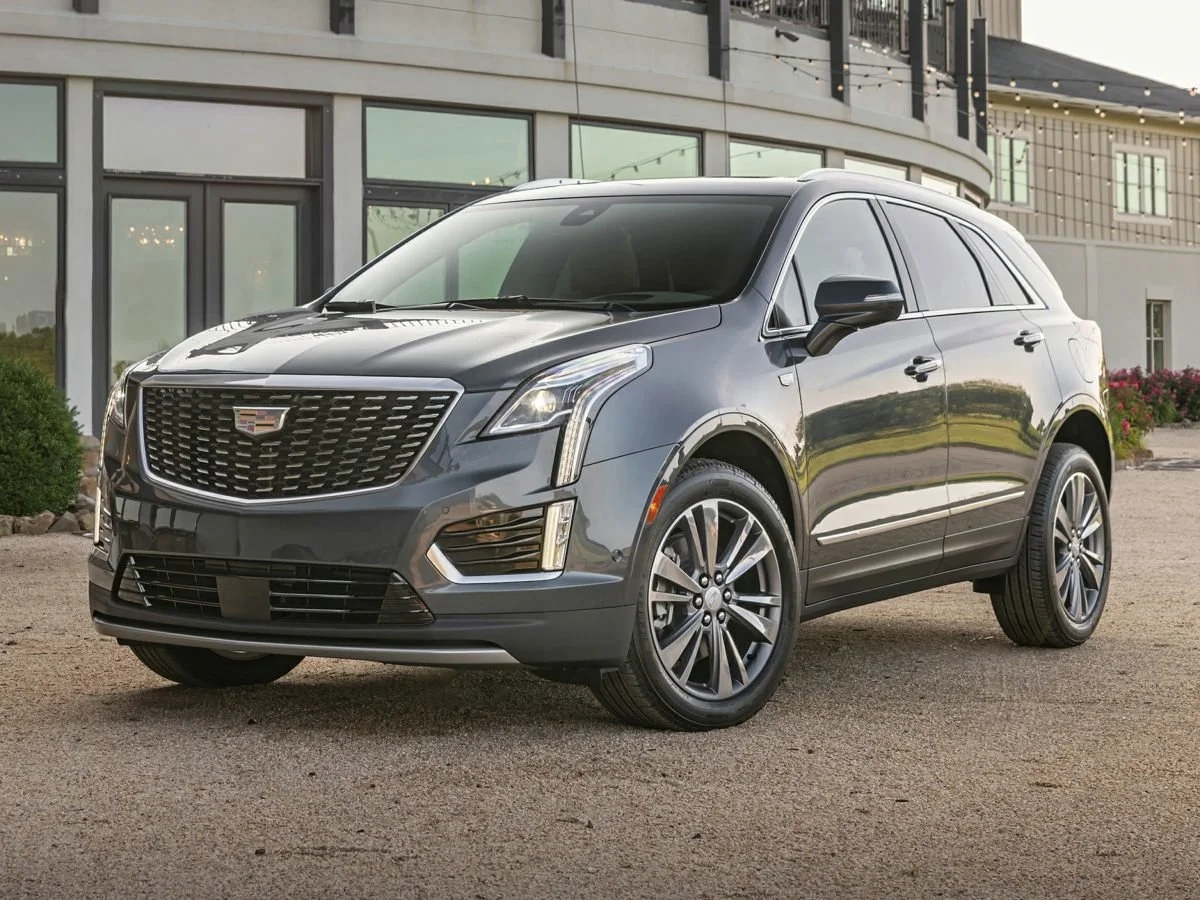
The Cadillac XT5
Here you will find yearly Canadian, U.S and Chinese market sales figures for the Cadillac XT5. The Cadillac XT5 is a mid-size luxury crossover SUV produced by Cadillac, an American automobile manufacturer. It was introduced in 2016 and is currently in its second generation.
Cadillac XT5 Overview
The XT5 is available with a choice of two engines: a 2.0-liter turbocharged four-cylinder engine and a 3.6-liter V6 engine. The 2.0-liter engine produces 237 horsepower and 258 pound-feet of torque, while the 3.6-liter engine produces 310 horsepower and 271 pound-feet of torque. Both engines are available with rear-wheel drive or all-wheel drive.
The XT5 is available in four trim levels: Luxury, Premium Luxury, Sport, and Platinum. The Luxury trim is the base trim level and comes standard with features such as a 10.25-inch touchscreen infotainment system, a rearview camera, and Bluetooth connectivity. The Premium Luxury trim adds features such as a Bose sound system, a sunroof, and heated front seats. The Sport trim is the most performance-oriented trim level and comes standard with features such as a sport-tuned suspension, a limited-slip differential, and 19-inch wheels. The Platinum trim is the most luxurious trim level and comes standard with features such as a 14-speaker AKG sound system, a panoramic sunroof, and ventilated front seats.
Cadillac XT5 US Sales Data & Charts
U.S Monthly Sales
U.S Annual Sales
| Year | Sales Units |
|---|---|
| 2016 | 36,462 |
| 2017 | 68,312 |
| 2018 | 60,566 |
| 2019 | 49,878 |
| 2020 | 35,224 |
| 2021 | 28,378 |
| 2022 | 27,340 |
| 2023 | 26,808 |
| 2024 | 6,275 |
U.S Annual Growth
Cadillac XT5 Canada Sales Data & Charts
Canada Annual Sales
Year Sales Units
2015
892
2016
3,033
2017
6,586
2018
5,875
2019
5,175
2020
4,217
2021
4,340


