
The Cadillac ATS
Here you will find Canadian, U.S and Chinese market sales figures for the Cadillac ATS. The Cadillac ATS was a compact luxury sports sedan produced by Cadillac, a division of General Motors. It was first introduced for the 2013 model year as a new entry-level model in Cadillac’s lineup. The ATS aimed to compete with other luxury compact sedans like the BMW 3 Series and the Mercedes-Benz C-Class.
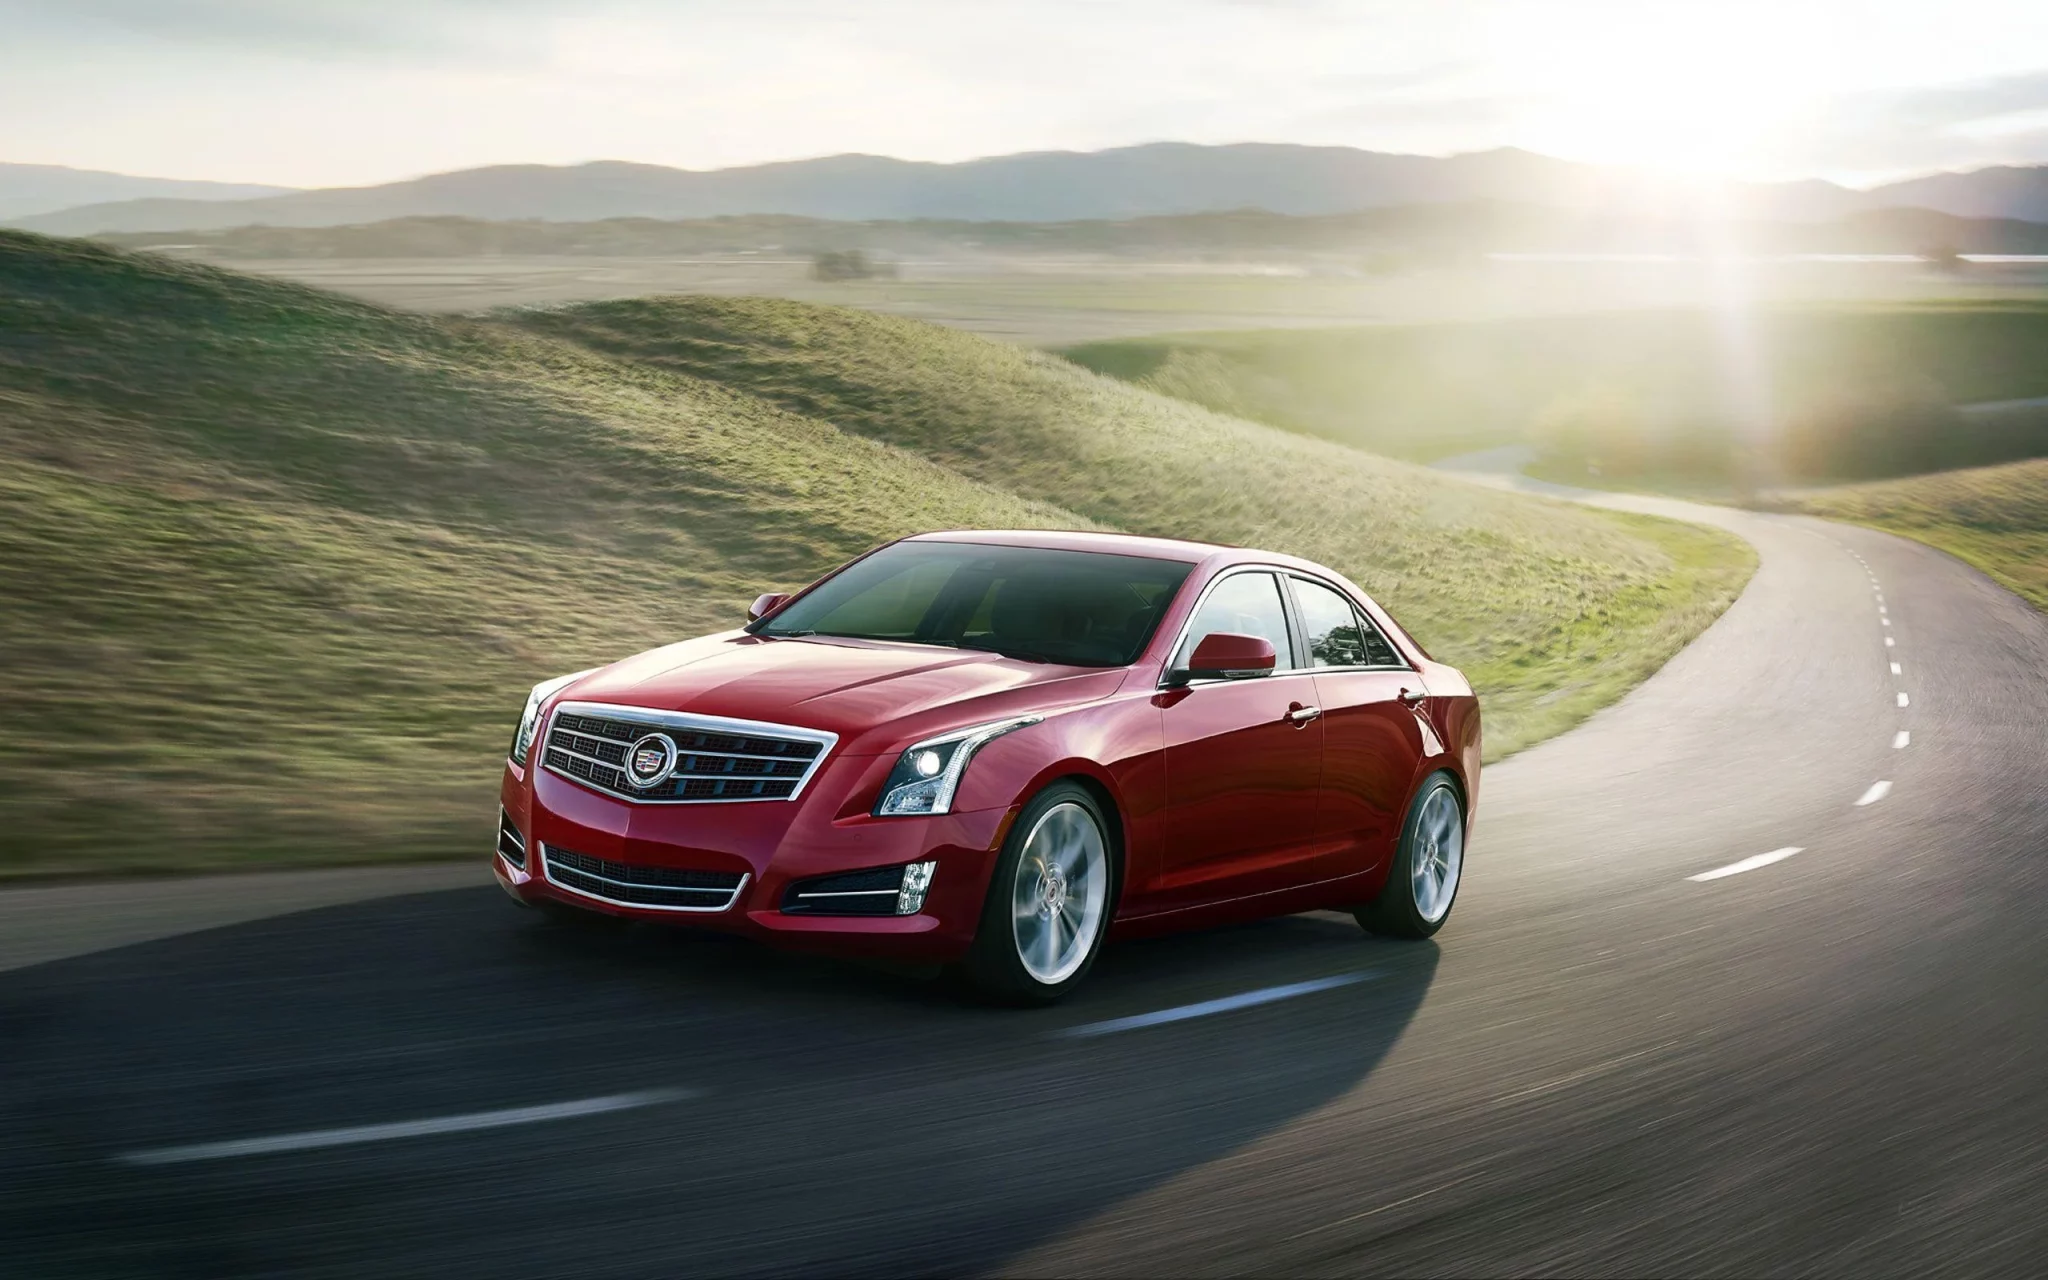
The Cadillac ATS Overview
The Cadillac ATS is a compact luxury car produced by Cadillac, an American automobile manufacturer. It was introduced in 2013 and was discontinued in 2019. The ATS was available with a choice of two engines: a 2.0-liter turbocharged four-cylinder engine or a 3.6-liter V6 engine. The 2.0-liter engine produced 272 horsepower and 295 pound-feet of torque, while the 3.6-liter engine produced 321 horsepower and 273 pound-feet of torque. Both engines were available with rear-wheel drive or all-wheel drive.
The ATS was available in three trim levels: Luxury, Premium Luxury, and Vsport. The Luxury trim was the base trim level and came standard with features such as a 7-inch touchscreen infotainment system, a rearview camera, and Bluetooth connectivity. The Premium Luxury trim added features such as a 10-speaker Bose sound system, a sunroof, and heated front seats. The Vsport trim was the most performance-oriented trim level and came standard with features such as a sport-tuned suspension, a limited-slip differential, and 18-inch wheels.
The ATS was praised for its handling, performance, and interior quality. However, it was criticized for its relatively high price and its small backseat. Overall, the Cadillac ATS was a well-rounded compact luxury car that offered a good balance of performance, handling, and luxury. It was a good choice for those looking for a sporty and stylish car that was also comfortable and well-equipped.
Cadillac ATS U.S Sales Data & Charts
U.S Annual Sales
| Year | Sales Units |
|---|---|
| 2012 | 7,008 |
| 2013 | 38,319 |
| 2014 | 29,890 |
| 2015 | 26,873 |
| 2016 | 21,505 |
| 2017 | 13,100 |
| 2018 | 10,860 |
| 2019 | 1,134 |
| 2020 | 115 |
U.S Annual Growth
Cadillac ATS Canada Sales Data & Charts
Canada Annual Sales
| Year | Sales Units |
|---|---|
| 2012 | 189 |
| 2013 | 3,256 |
| 2014 | 3,714 |
| 2015 | 3,493 |
| 2016 | 2,375 |
| 2017 | 2,164 |
| 2018 | 1,615 |
| 2019 | 1,032 |
Canada Annual Growth
Cadillac ATS-L China Sales Data & Charts
The ATS-L was replaced by the Cadillac CT4 in 2020.


