
The BMW X6
Here you will find monthly and yearly U.S, Canadian and European market sales figures for the BMW X6. In a highly competitive class that features some of the best vehicles on the market, the BMW X6 comes in below average. While we love X6’s performance (three engine options) and dynamics (sport sedan-like) but it is let down by shoddy interior quality, ugly design and a lack of any real usable space. It sits in no-man’s land and yet sales have been pretty solid over the years which speaks to the continued move to SUVs by the masses.
BMW X6 Overview
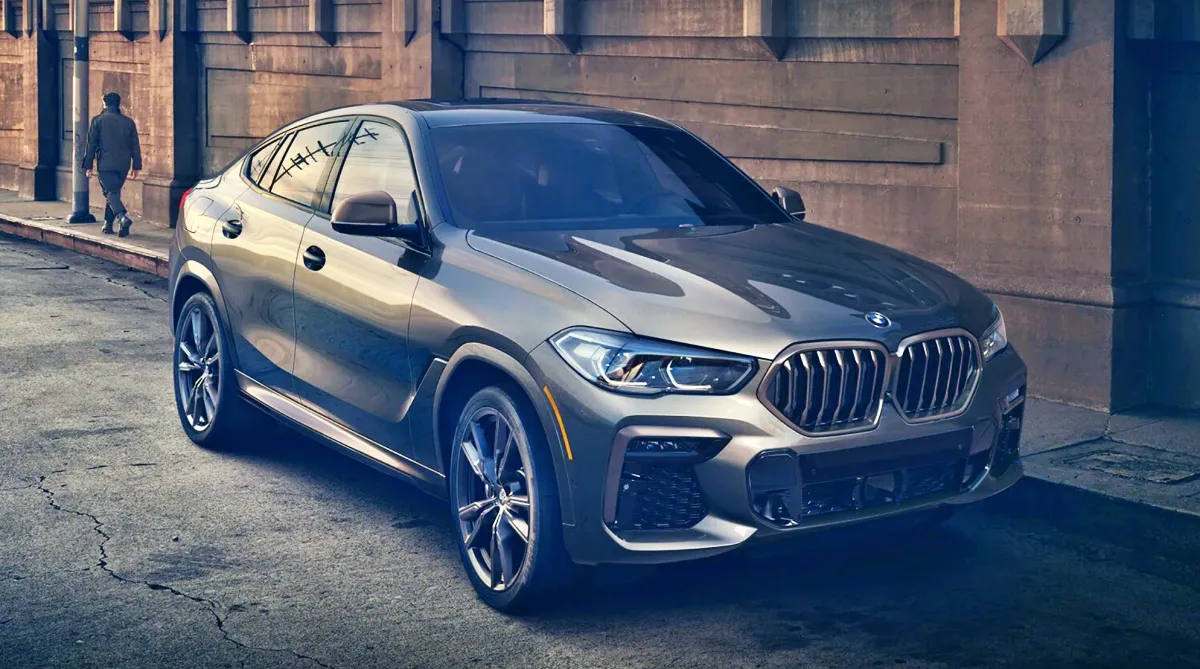
The BMW X6 is a midsize luxury crossover SUV produced by the German automaker BMW. The X6 is known for its unique and distinctive design, combining SUV practicality with coupe-like styling elements. It falls under the category of “Sports Activity Coupe” in BMW’s lineup, offering a more dynamic and sporty appearance compared to traditional SUVs. The BMW X6 features a bold and muscular design, characterized by its sloping roofline, coupe-like silhouette, and a prominent kidney grille. Its design sets it apart from conventional SUVs, giving it a more athletic and eye-catching presence.
The X6 shares its platform with the BMW X5, as both models are built on BMW’s CLAR (Cluster Architecture) platform. This platform provides a balance of performance, comfort, and structural rigidity. Just like other BMW models, the X6 offers higher-performance variants under the M Performance and M models. The BMW X6 M and X6 M Competition models provide even more power, sport-tuned suspensions, and other performance upgrades for a thrilling driving experience. The BMW X6 competes in the midsize luxury SUV coupe segment against rivals like the Mercedes-Benz GLE Coupe, Audi Q8, Porsche Cayenne Coupe, and other similar models.
The X6 is available with a choice of four powertrains: a turbocharged 3.0-liter inline-six, a twin-turbo 4.4-liter V8, a plug-in hybrid, and a M50i performance model. All models come standard with all-wheel drive. The X6 is known for its sporty handling, stylish design, and advanced technology. Standard features include a 12.3-inch digital instrument cluster, a 10.25-inch touchscreen infotainment system, a Harman Kardon sound system, and a panoramic sunroof. Available features include a head-up display, a night vision system, and a Bowers & Wilkins sound system. The 2023 BMW X6 starts at $67,400 in the United States. Prices vary depending on the powertrain and options selected.
BMW X6 Sales Data & Trends
This is a niche model so sales of the X6 are way lower than its sibling X5. It has always been a polarizing design and BMW markets it as a more exclusive model which is why you see sales are lower too.
BMW X6 US Sales Data & Charts
U.S Monthly Sales
U.S Annual Sales
| Year | Sales Units |
|---|
U.S Annual Growth
BMW X6 Canada Sales Data & Charts
Canada Annual Sales
Year Sales Units


