
The BMW i3
Here you will find monthly and yearly U.S. sales figures for the BMW i3. We all know electric vehicles are the future and BMW is going all out to be at the forefront of this monumental market shift. The BMW Group offers a total of seven electrified vehicles, the broadest range of any manufacturer, selling across the BMW brand as well as Mini too. BMW has a sub brand that it calls the “i-series” for vehicles that stand on their own (vs being part of the traditional 3, 5, 7 series model ranges). In BMWs case today that is two models, the BMW i3 and the BMW i8.
Don’t forget to check out the BMW Group Sales Reports and the BMW brand compared with all other brands in the monthly Auto Sales By Brand post. See the BMW i3 compared with its rivals in the monthly Small Luxury Car Sales charts. Specific BMW related sales reports can also be found here at: BMW Brand, 1-Series, 2-Series, 3-Series, 4-Series, 5-Series, 6-Series, 7-Series, Z4 ,Z8 , i-Series, i3, i8, X1, X3, X4, X5, X6. To see sales figures for the whole BMW i Series family, click here. BMW Canada’s figures for the i3 are joined with the i8’s.
BMW i3 Overview
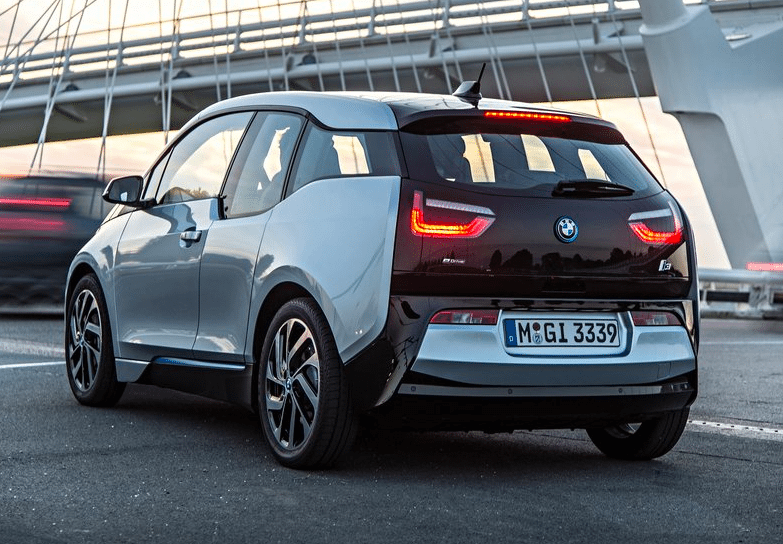
The BMW i3 is an all-electric hatchback that was produced by BMW from 2013 to 2022. It was BMW’s first mass-produced zero emissions vehicle and was launched as part of BMW’s electric vehicle BMW i sub-brand. The i3 is a B-segment, high-roof hatchback with an electric powertrain. It uses rear-wheel drive via a single-speed transmission and an underfloor lithium-ion battery pack with an optional range-extending petrol engine.
The i3 was praised for its futuristic design, spacious interior, and engaging driving dynamics. However, it was also criticized for its high price tag and limited range. The i3 was available in two main variants: the i3 and the i3s. The i3 was the base model, while the i3s was a more performance-oriented version. The i3s had a slightly more powerful electric motor and a sportier suspension setup.
The i3 was also available with an optional range-extender, which was a small gasoline engine that powered the electric motor when the battery was low. The range-extender added about 100 miles of range to the i3, but it also reduced the car’s fuel efficiency. The BMW i3 was discontinued in 2022, but it remains a popular choice for those looking for an all-electric car with a unique design and engaging driving dynamics.
BMW i3 Sales Data & Trends
BMW has spent a lot of money and time on electric vehicle technology and it shows with the delivery of over 62,000 electrified vehicles in 2016 across the group. Recently, BMW announced new car architecture to enable ‘electrification of every model series’. The company has announced that all brands and model series can be electrified, with a full-electric or plug-in hybrid drivetrain being offered in addition to the combustion engine option. Additional electrified models will be brought to market in the coming years and beyond 2020, the company’s next generation vehicle architecture will enable further fully-electric vehicles.
Sales of BMW Group electric and plug-in hybrid electric vehicles increased 9.2 percent to 11,672 through August 2017, accounting for 5.2 percent of total BMW brand sales in the U.S. In addition the numbers you see on this page which counts only the BMW i3 and BMW i8, the broader growth also comes from electric and hybrid offerings from across its standard model portfolio including BMW i Performance models: BMW 330e, BMW 530e, BMW 740e and the BMW X5 xDrive 40e. While U.S and Canadian sales for the i3 and i8 were down a lot in 2016 and into 2017 it is clear that electric cars are picking up steam. BMW has said that they see electric cars being better integrated into the core offerings and allowing the special “i” branded cars to be more aggressive and niche.
BMW i3 US Sales Data & Charts
U.S Annual Sales
| Year | Sales Units |
|---|---|
| 2014 | 6,092 |
| 2015 | 11,024 |
| 2016 | 7,625 |
| 2017 | 6,276 |
| 2018 | 6,120 |
| 2019 | 4,853 |
| 2020 | 1,502 |
| 2021 | 1,476 |
| 2022 | 9 |
| 2024 | 1 |
U.S Annual Growth
BMW i3 Europe Sales Data & Charts
Europe Annual Sales
Europe Annual Growth
BMW i3 China Sales Data & Charts
Sales figures for the BMW i3 in China. NOTE: The Chinese i3 is a completely different car than the BMW i3 in Europe or the USA. In fact, it’s the electric version of the BMW 3-Series L. It was launched in 2022 as the i3 eDrive35L.


