
Bentley Sales Data, Trends, Analysis & Current Lineup for the U.S Automotive Market
This is your hub for all of the Bentley sales data for the U.S market. Headquartered in Crewe, England, the company was founded as Bentley Motors Limited by W. O. Bentley in 1919 and has had a long and interesting history. Since 1998 has been a subsidiary of Volkswagen AG. The current Bentley lineup is made up of the Continental Flying Spur, Continental GT, Bentley Bentayga and the Bentley Mulsanne. Today most Bentleys are assembled at the company’s Crewe factory, with a small number assembled at Volkswagen’s Dresden factory, Germany. There is no doubt that Bentley is the most successful upper-luxury brand of the Volkswagen Group in terms of sales volume in the last decade thanks in large part to the Continental GT which has been the cornerstone of the Bentley brand and its best selling car since its introduction in 2003 and the relatively new Bentaya SUV.
Bentley U.S Sales Figures & Recent Highlights
Bentley has no production facilities in the US. They are only importing their vehicles from UK to the US. Despite being a European car manufacturer, Bentley has been doing fine in the US market. In fact, the North American region is the company’s number one market for years. This is due to the popularity of their GT cars among Americans such as the new Continental GT.
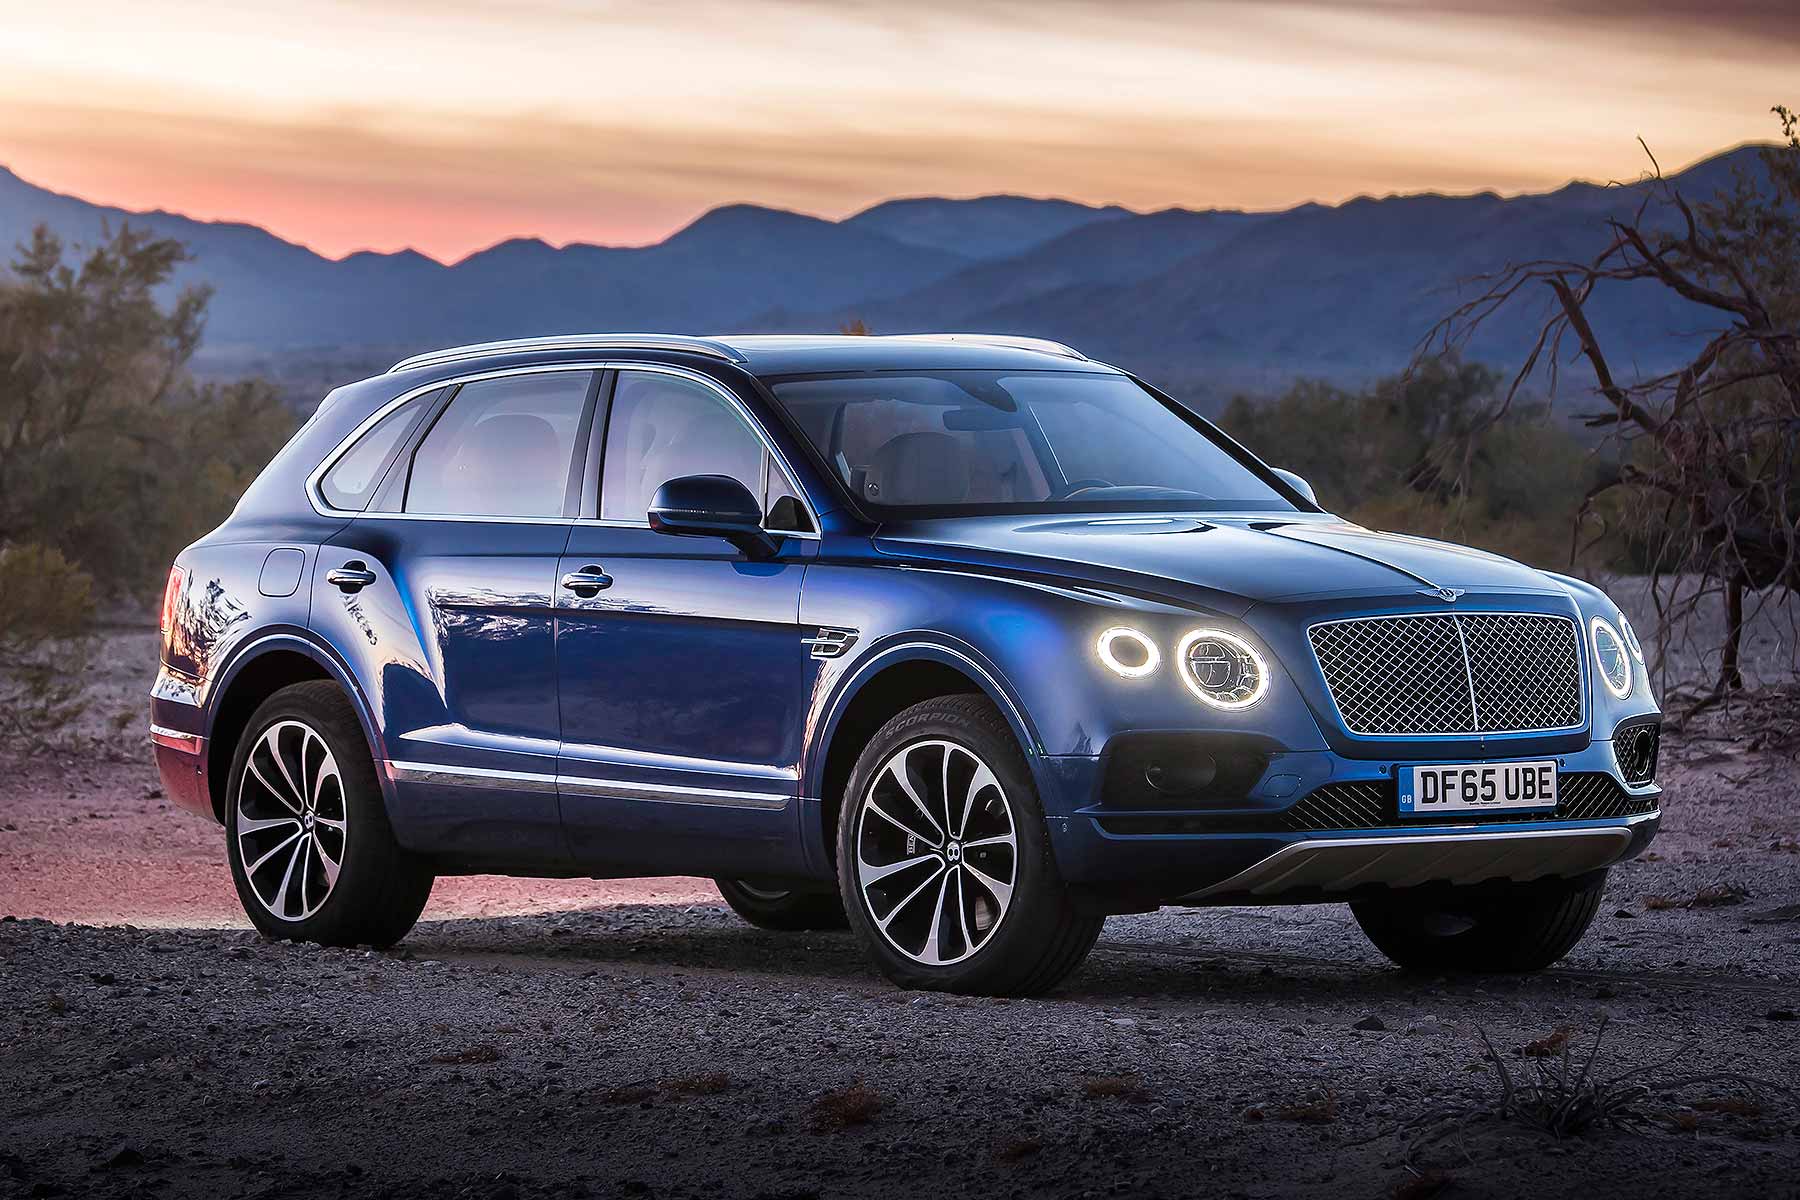
The Bentley Bentayga, launched in 2016, marked Bentley’s entry into the luxury SUV segment. Given the growing global demand for SUVs and the popularity of this segment, the Bentayga was a strategic move for Bentley. Soon after its launch, the Bentayga quickly became a significant sales driver for Bentley. In some years, it even accounted for almost half of Bentley’s global sales, highlighting its importance in the lineup. The introduction of the Bentayga provided a substantial boost to Bentley’s overall sales. In 2017, for instance, Bentley delivered a total of 11,089 cars globally, a rise largely attributed to the popularity of the Bentayga.
The SUV appealed to a broader audience and allowed Bentley to tap into newer markets and demographics, especially younger buyers and more female buyers. Over the years, Bentley introduced various versions of the Bentayga, including the V8, Speed, and Hybrid models. These variants catered to different customer preferences and further strengthened its market presence.
Like all automakers, Bentley faced challenges, including economic downturns, changing regulations, and the global COVID-19 pandemic. However, the popularity of the Bentayga helped cushion the brand during some of these challenges. The success of the Bentayga prompted other ultra-luxury automakers to accelerate their plans in the SUV segment, with vehicles like the Rolls-Royce Cullinan and Aston Martin DBX coming to market.
Bentley U.S Monthly Sales Data
Below we have a table that shows Bentley sales for the United States automotive market, but this time it is broken out by month. This is on a unit basis. This is Bentley new vehicle sales in the US.
Bentley Annual Sales, Growth & Market Share in the United States
Below we have a table that shows total Bentley sales volumes for the U.S automotive market, broken out by year. This data captures all Bentley vehicle sales for the entire U.S automotive market.
| Year | Sales | YOY Change | US Marketshare | Marketshare Change |
|---|---|---|---|---|
| 2016 | 1,788 | 0.00 | 0.01 | 0.00 |
| 2017 | 2,405 | 34.51 | 0.01 | 26.99 |
| 2018 | 155 | -93.56 | 0.00 | -1,460.49 |
| 2019 | 0 | -100.00 | 0.00 | 0.00 |
| 2020 | 0 | 0.00 | 0.00 | 0.00 |
| 2021 | 0 | 0.00 | 0.00 | 0.00 |
| 2022 | 0 | 0.00 | 0.00 | 0.00 |
| 2023 | 0 | 0.00 | 0.00 | 0.00 |
| 2024 | 0 | 0.00 | 0.00 | 0.00 |
Bentley U.S Annual Sales Units & Growth Chart
Below is a visual representation of Bentley’s U.S sales units over time. We have both the Bentley sales units and the growth in the United States market. Click on the items in the legend to see each series by itself.
Bentley U.S Growth Rate & Market Share Chart
Below is the annual growth rate for the Bentley brand in the United States, shown against the Bentley’s marketshare changes in the United States. This gives you a good look into how Bentley has faired against the other brands in terms of absolute sales and effect on marketshare. Click on the items in the legend to see each series by itself.
The Best-Selling Bentley Cars & SUVs in the U.S
Here are the best-selling Bentley models in the United States. These are just the top 5 best-selling Bentley models in the United States. Bentley has a small lineup of cars and SUVs to choose from so no surprises below.
- Bentley Bentayga: The Bentayga is a luxury SUV that is known for its powerful engines, luxurious interior, and off-road capabilities. It is available with a variety of engines, including a twin-turbocharged 4.0-liter V8 engine, a twin-turbocharged 6.0-liter W12 engine, and a plug-in hybrid powertrain.
- Continental GT: The Continental GT is a luxury grand tourer that is known for its elegant design, powerful engines, and comfortable ride. It is available with a variety of engines, including a twin-turbocharged 4.0-liter V8 engine and a twin-turbocharged 6.0-liter W12 engine.
- Flying Spur: The Flying Spur is a luxury sedan that is known for its spacious interior, powerful engines, and comfortable ride. It is available with a variety of engines, including a twin-turbocharged 4.0-liter V8 engine and a twin-turbocharged 6.0-liter W12 engine.
- Mulsanne: The Mulsanne is a luxury sedan that is known for its handcrafted interior, powerful engines, and comfortable ride. It is available with a 6.75-liter V8 engine.
- Bentayga Speed: The Bentayga Speed is the fastest and most powerful version of the Bentayga SUV. It is powered by a twin-turbocharged 6.0-liter W12 engine that produces 626 horsepower and 664 pound-feet of torque. It can accelerate from 0 to 60 mph in 3.9 seconds and has a top speed of 190 mph.
The Current Bentley Model Lineup & Prices in the U.S
Here are the current Bentley models available in the US, along with their starting MSRPs and a brief description. Bentley doesn’t offer many models but they do have lots of options within each model, literally hundreds of options. In terms of powertrains, it is important to note that Bentley now offers non-gas engined options. Bentley’s journey into an electric future continues and the introduction of hybrid technology is an important stage on that journey, with a range of hybrid vehicles now available. In the years ahead, Bentley will reveal its first fully electric vehicle, making the shift to an all-electric line-up by 2030.
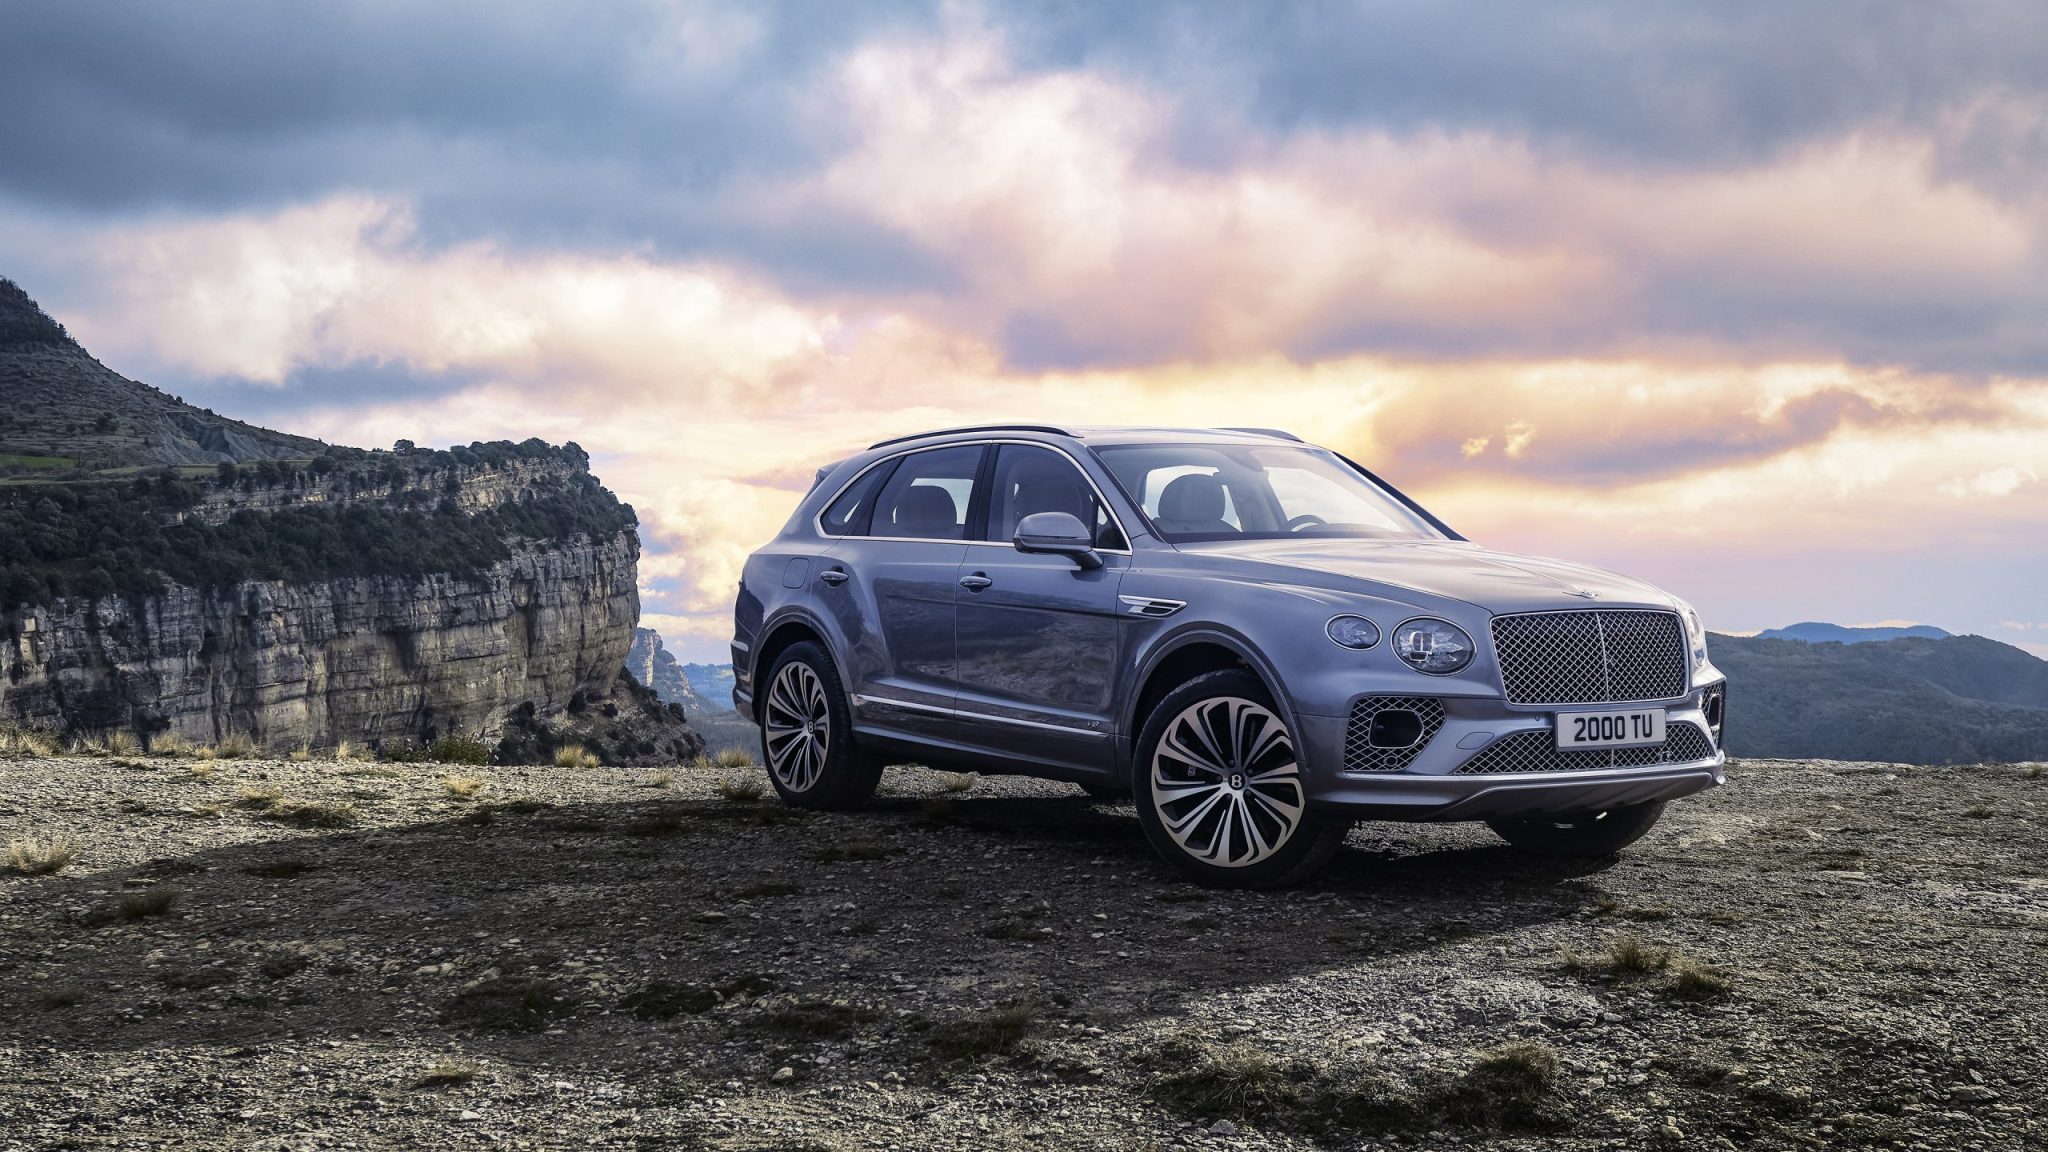
Bentley Bentayga
Bentayga: $197,300 / Bentayga EWB: $226,900 / Bentayga Hybrid: $197,300 / Bentayga Speed: $263,000
The Bentley Bentayga is the brand’s flagship SUV. It is available with either a 4.0L V8 engine or a 6.0L W12 engine. The Bentayga EWB is a longer-wheelbase version of the Bentayga, while the Bentayga Hybrid is a plug-in hybrid. The Bentayga Speed is the most powerful version of the Bentayga, with a top speed of 190 mph.
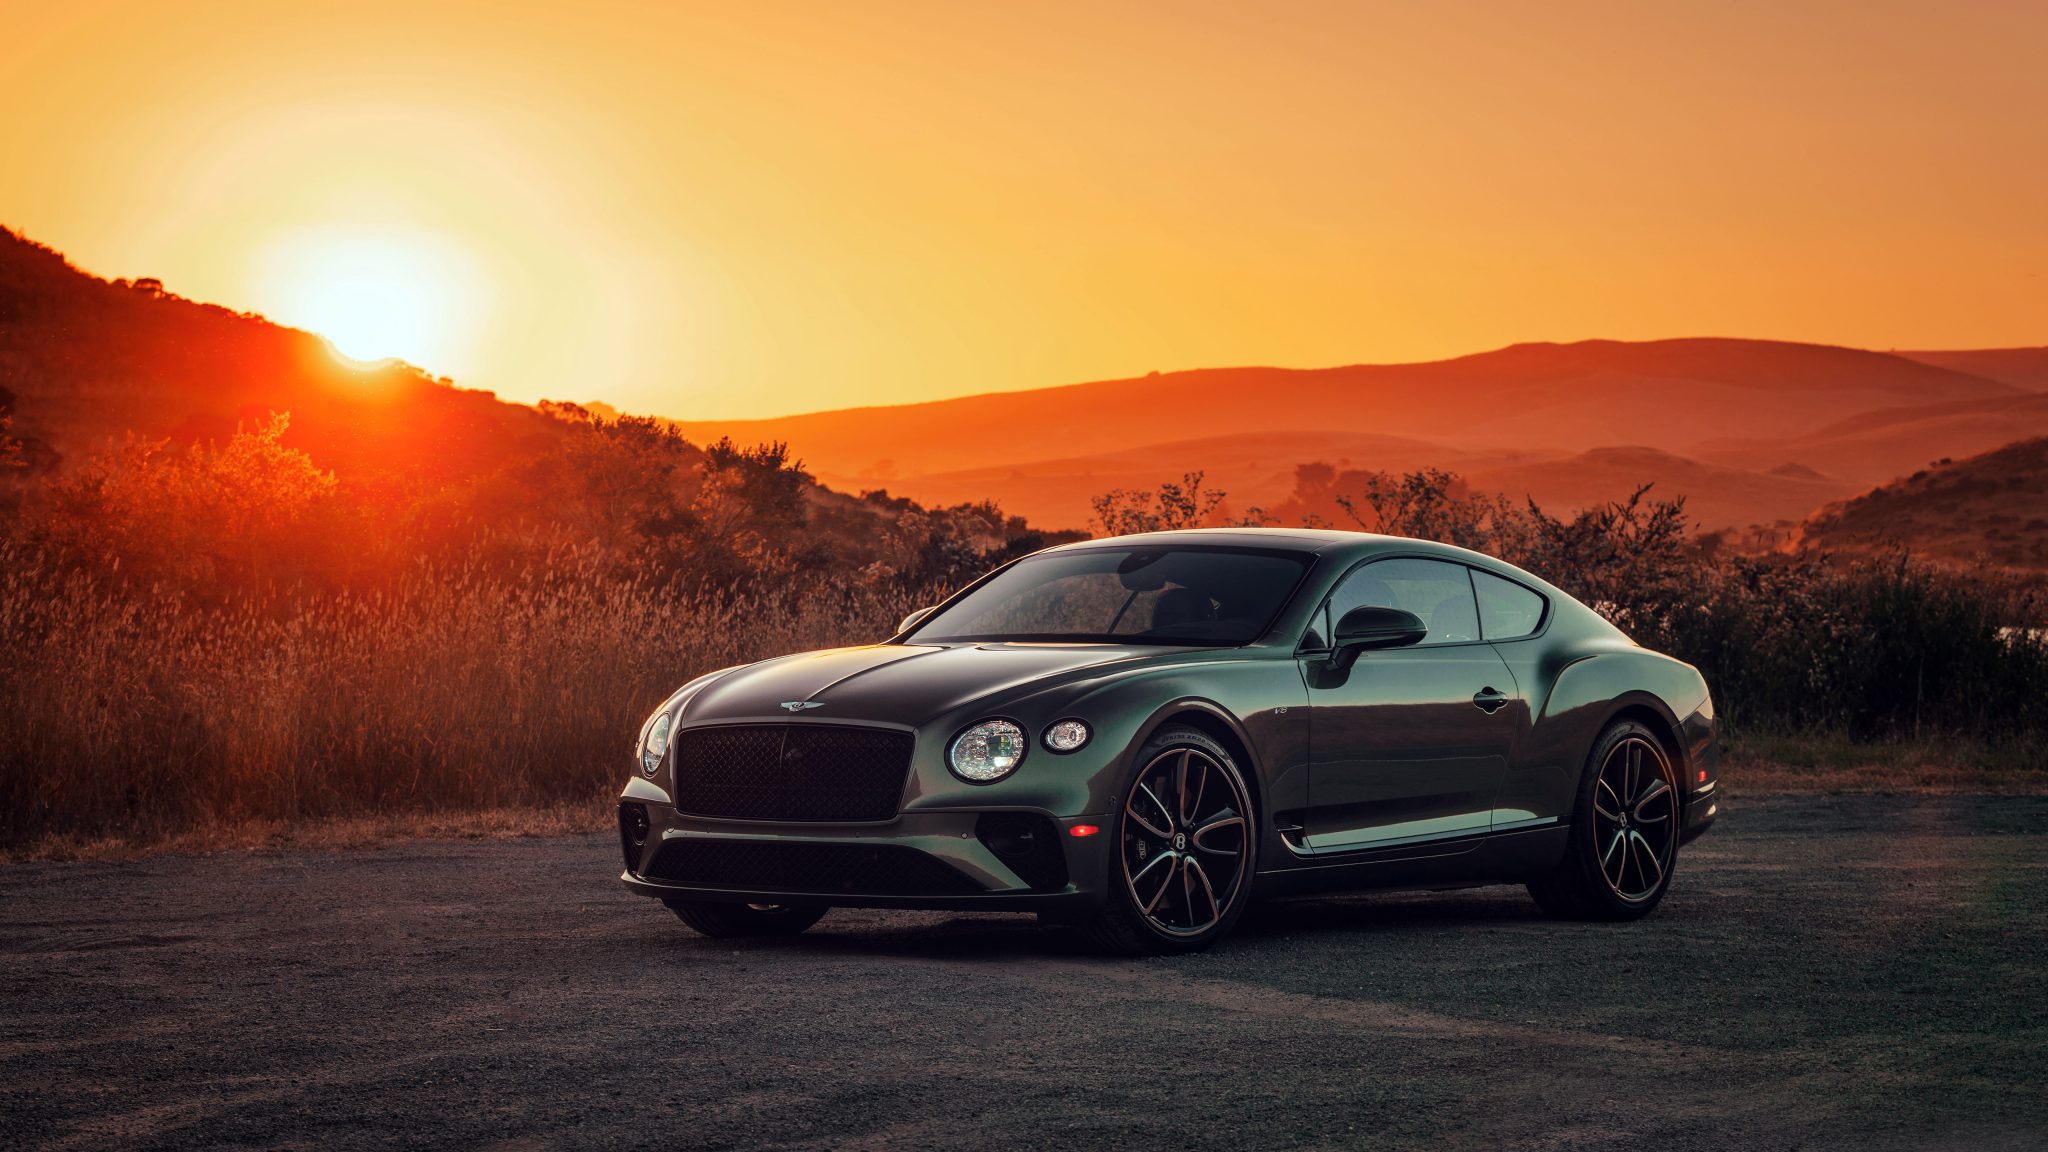
Bentley Continental GT
Continental GT Coupe V8: $235,600 / Continental GT Coupe S: $269,325 / Continental GT Coupe Azure: $284,925 / Continental GT Coupe Speed: $291,225 / Continental GT Coupe Mulliner: $309,325 / Continental GT Convertible V8: $261,925 / Continental GT Convertible S: $295,225 / Continental GT Convertible Azure: $313,725 / Continental GT Convertible Speed: $320,025 / Continental GT Convertible Mulliner: $328,925
The Bentley Continental GT is a grand tourer that is available as either a coupe or convertible. It is powered by a 4.0L V8 engine or a 6.0L W12 engine. The Continental GT S is a more performance-oriented version, while the Continental GT Azure is a more luxurious version. The Continental GT Speed is the most powerful version of the Continental GT, with a top speed of 208 mph.
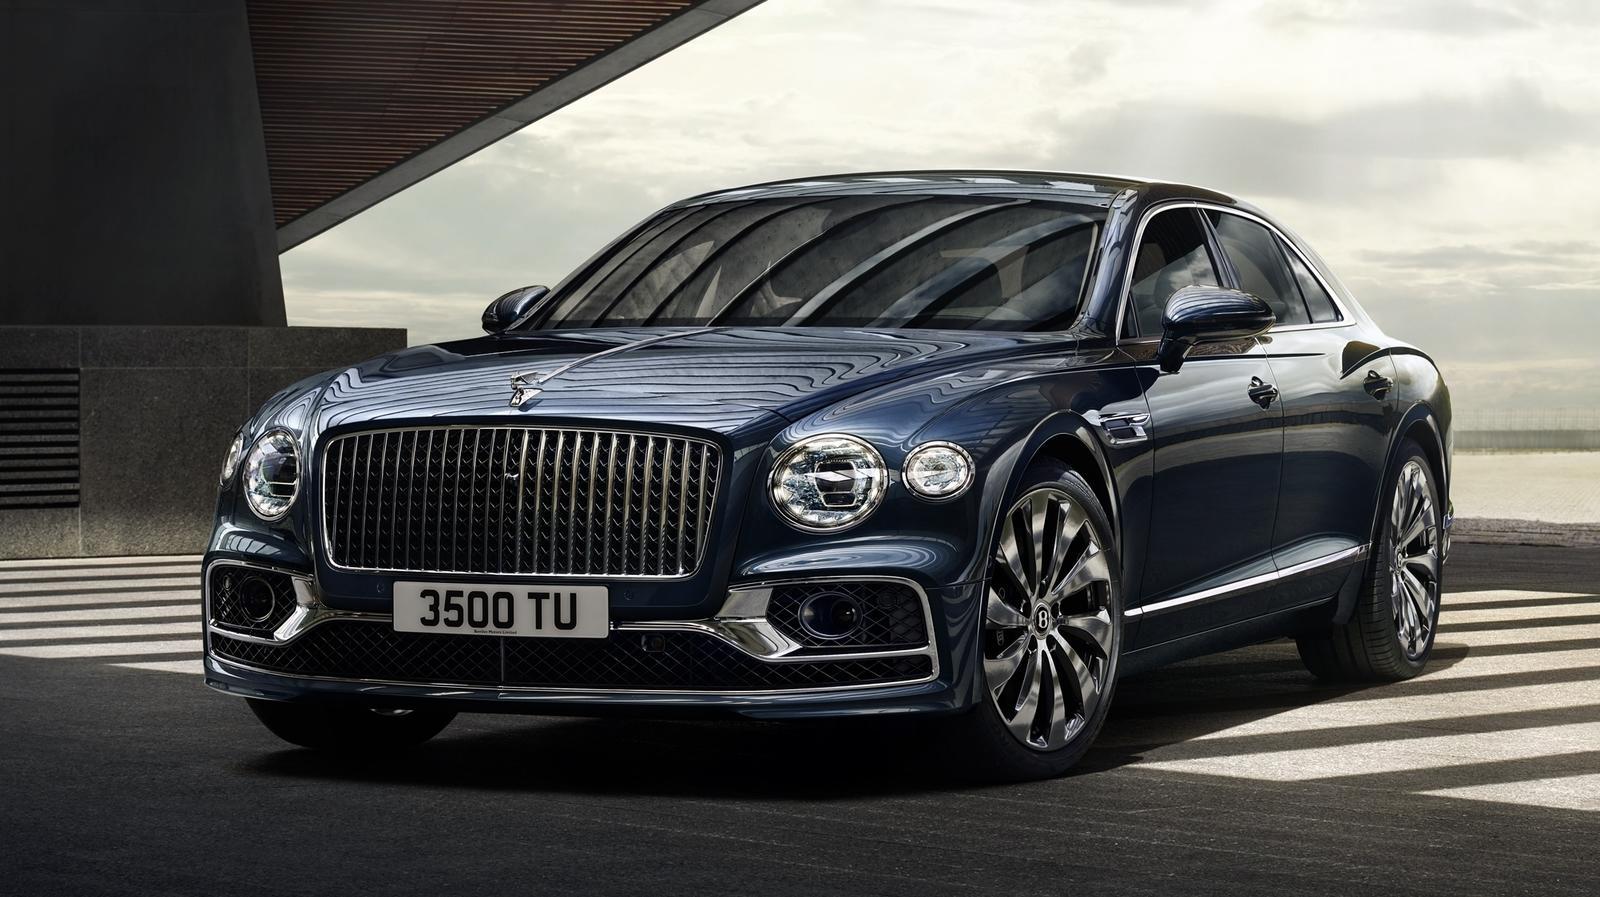
Bentley Flying Spur
Flying Spur V8: $208,600 / Flying Spur S Hybrid: $243,000 / Flying Spur V8 Mulliner: $265,000 / Flying Spur S V8: $245,000 / Flying Spur Hybrid: $214,800 / Flying Spur S Hybrid Mulliner: $269,800
The Bentley Flying Spur is a luxury sedan that is available with either a 4.0L V8 engine or a 6.0L W12 engine. The Flying Spur S Hybrid is a plug-in hybrid. The Flying Spur Mulliner is the most luxurious version of the Flying Spur.
Bentley Mulliner
Custom: If you have to ask
With roots that can be traced back to before the birth of the motor car, Mulliner operates today as Bentley’s personal commissioning division. From special features and finishes to entirely new coachbuilt vehicles, the Mulliner name continues to represent the ultimate in Bentley luxury. You can’t just walk into a Bentley dealer and order one, you have to contact Bently and have one “commissiond”.


