
The Bentley Continental GT
Here you will find monthly and yearly Canadian and U.S. sales figures for the Bentley Continental GT. There is no doubt that Bentley is the most successful upper-luxury brand of the Volkswagen Group in terms of sales volume in the last decade thanks in large part to the Continental GT which has been the cornerstone of the Bentley brand and its best selling car since its introduction in 2003. It combines great looks, effortless performance and the level of luxury on Bentley can delivery. The perfect GT.
Bentley Continental GT Overview
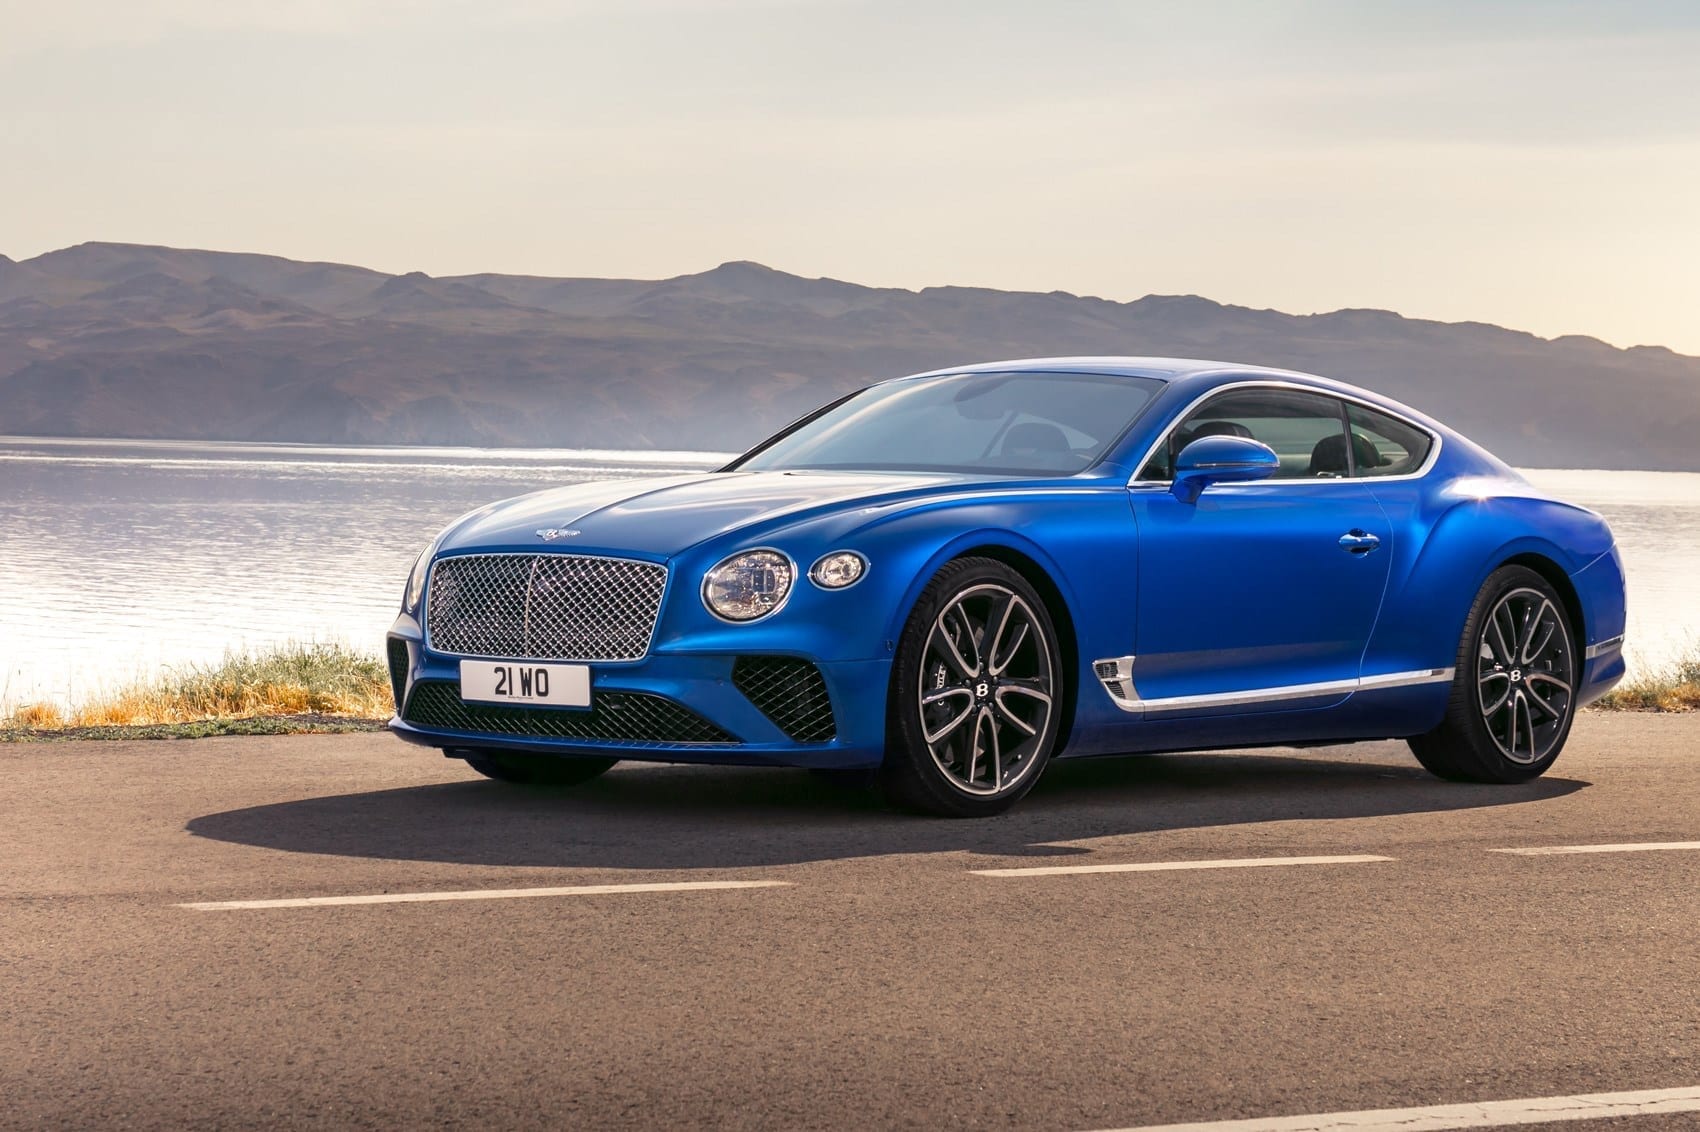
The Bentley Continental GT is a luxury grand tourer (GT) manufactured by Bentley Motors, a British luxury automobile brand. The Continental GT is one of Bentley’s most iconic and popular models, known for its blend of performance, luxury, and craftsmanship. It is designed to provide a comfortable and exhilarating driving experience for long-distance journeys. The Bentley Continental GT has a distinctive and elegant design, reflecting the classic grand tourer styling cues with modern touches. It features a sleek and aerodynamic body shape, a prominent front grille with the iconic Bentley Flying B mascot, and stylish LED headlights. The vehicle’s overall appearance exudes a sense of power, luxury, and sophistication.
Bentley has introduced various variants of the Continental GT over the years, including convertible versions (Continental GT Convertible) and performance-focused models like the Continental GT Speed and the Continental GT V8 S. The Bentley Continental GT has earned praise from automotive enthusiasts and critics alike for its combination of luxury, performance, and craftsmanship. It remains a symbol of prestige and refinement in the luxury GT segment.
Bentley Continental GT Sales Data & Trends
The last decade has been nothing but awesome for Bentley in terms of sales success and it has all largely been driven by the Continental GT. To give some perspective, the Bentley factory is the largest producer of the W12 engine globally, 66,537 have been built since the introduction of the Continental GT in 2003. And boy what a year 2003 was. The first generation Bentley Continental GT was named the most significant production car design at the NAIAS eyes on design awards, since then the car has won numerous awards including Grand Tourer of the Year award by Top Gear magazine, and is twice winner of the ‘Classic Car of the Future’ award from Motor Klassik magazine. It was a sales success almost overnight, propelling the brand to over 10,000 sales per year.
Recent years have been tough on the model, largely due to lack of investment. The Continental GT hasn’t really changed much other than some small facelifts and the introduction of the Continental GT V8 S. In 2018 things get more interesting again, but Bentley seems to have created a cracking GT that amps things to 11.
Bentley finally unleashed the third-generation Continental GT. The exterior styling is heavily based on the EXP 10 Speed 6 concept (that’s to say it is absolutely stunning), while the interior gets some of the features and materials seen in the SUV. Bentley also took the new 6.0-liter W-12 that it launched with the Bentayga and dropped it under the Continental GTs hood with revised internals and other drivetrain components. All told, the new Continental GT is sportier, quicker, more powerful, and more luxurious than the outgoing model. Can the update help Bentley get to its stated goal of doubling sales to 20,000 units per year by end of the decade? Based on what we’ve seen of the new GT, we say this is going to be another runaway sales success.
Bentley Continental GT US Sales Data & Charts
U.S Monthly Sales
U.S Annual Sales
Year Sales Units
2016
609
2017
898
U.S Annual Growth
Bentley Continental GT Canada Sales Data & Charts
Canada Annual Sales
Year Sales Units
2016
32
Canada Annual Growth
Bentley Continental GT Europe Sales Data & Charts
Europe Annual Sales


