
Audi Sales Data, Trends, Analysis & Current Lineup for the U.S Automotive Market
This is your hub for all of the Audi sales data for the U.S market. Audi is one of the premier car manufacturers in the world. They specialize in designing, engineering, producing, marketing, and distributing luxury vehicles. It is one of the best-selling luxury automobile brands in the world along with BMW and Mercedes-Benz. Their drive to incorporate innovation for all their vehicles has been attributed to their resurgence in the American market. Audi has sold cars in the United States since 1970. Audi also enjoys a huge success on the racetrack and currently own seven world records. Audi continues to innovate and grow its portfolio of cars and SUVs available for the U.S market.
Audi U.S Sales Figures & Recent Highlights
Here you will find monthly and yearly U.S. sales figures for the Audi brand. Globally, Audi is a sales juggernaut with each month seemingly a record vs a year ago and that says a lot when Audi say a record 2016, with global Audi sales of 1.871 million cars across the globe. In the U.S Audi is one of the fastest growing premium brands, breaking its sales records for more than 80 consecutive months. And there’s still plenty of room to grow, as the worldwide best selling premium brand still lags its two German rivals and Lexus by a lot in US sales. Currently all of Audi’s models for the US market are imported, but the brand opened its first North American assembly plant in Pueblo, Mexico where the Q5 SUV are produced.
Audi sold a total of 186,875 cars in the United States, down 5% from 2021. The best-selling model was the Q5, with 53,219 units sold, followed by the A4 with 37,886 units sold. In March 2023, Audi announced that it would be investing $1 billion in its U.S. production facilities as it expects to continue to grow strongly. In April 2023, Audi unveiled the all-electric Q6 e-tron SUV, which is scheduled to go on sale in the United States in 2024. In May 2023, Audi announced that it would be launching a subscription service for its cars in the United States.
Audi offers a wide variety of cars, SUVs, and electric vehicles to choose from. This gives buyers a lot of options to choose from, and it helps Audi appeal to a wide range of consumers. Audi has a good reputation for quality and reliability. This is important to many buyers, and it helps Audi attract new customers as do Audi’s amazing quality, modern interiors and sharp designs.
Audi U.S Monthly Sales Data
Below we have a table that shows Audi sales for the United States automotive market, but this time it is broken out by month. This is on a unit basis. This is Audi new vehicle sales in the US.
Audi Annual Sales, Growth & Market Share in the United States
Below we have a table that shows total Audi sales volumes for the U.S automotive market, broken out by year. This data captures all Audi vehicle sales for the entire U.S automotive market.
| Year | Sales | YOY Change | US Marketshare | Marketshare Change |
|---|---|---|---|---|
| 1972 | 26,703 | 0.00 | 20.22 | 0.00 |
| 1973 | 31,065 | 16.34 | 14.14 | -42.99 |
| 1974 | 23,984 | -22.79 | 13.59 | -4.06 |
| 1975 | 50,680 | 111.31 | 22.62 | 39.93 |
| 1976 | 33,316 | -34.26 | 13.45 | -68.26 |
| 1977 | 35,849 | 7.60 | 10.27 | -30.97 |
| 1978 | 40,882 | 14.04 | 10.74 | 4.42 |
| 1979 | 42,709 | 4.47 | 9.16 | -17.29 |
| 1980 | 41,274 | -3.36 | 4.16 | -120.11 |
| 1981 | 49,787 | 20.63 | 3.87 | -7.62 |
| 1982 | 47,473 | -4.65 | 3.88 | 0.42 |
| 1983 | 34,079 | -28.21 | 2.07 | -87.83 |
| 1984 | 66,566 | 95.33 | 3.15 | 34.46 |
| 1985 | 73,696 | 10.71 | 1.99 | -58.70 |
| 1986 | 59,254 | -19.60 | 1.49 | -33.58 |
| 1987 | 41,187 | -30.49 | 1.13 | -31.71 |
| 1988 | 22,903 | -44.39 | 0.59 | -90.24 |
| 1989 | 21,270 | -7.13 | 0.61 | 2.71 |
| 1990 | 19,981 | -6.06 | 0.66 | 8.07 |
| 1991 | 11,479 | -42.55 | 0.42 | -58.49 |
| 1992 | 14,254 | 24.17 | 0.55 | 23.70 |
| 1993 | 11,981 | -15.95 | 0.44 | -26.09 |
| 1994 | 12,575 | 4.96 | 0.52 | 16.66 |
| 1995 | 1,087 | -91.36 | 0.04 | -1,211.47 |
| 1996 | 1,183 | 8.83 | 0.04 | 7.08 |
| 1997 | 1,255 | 6.09 | 0.04 | 0.79 |
| 1998 | 660 | -47.41 | 0.02 | -104.40 |
| 1999 | 0 | -100.00 | 0.00 | 0.00 |
| 2000 | 0 | 0.00 | 0.00 | 0.00 |
| 2001 | 0 | 0.00 | 0.00 | 0.00 |
| 2002 | 0 | 0.00 | 0.00 | 0.00 |
| 2003 | 0 | 0.00 | 0.00 | 0.00 |
| 2004 | 0 | 0.00 | 0.00 | 0.00 |
| 2005 | 80,637 | 0.00 | 0.47 | 100.00 |
| 2006 | 90,113 | 11.75 | 0.54 | 12.87 |
| 2007 | 93,599 | 3.87 | 0.58 | 6.29 |
| 2008 | 87,761 | -6.24 | 0.66 | 12.35 |
| 2009 | 82,761 | -5.70 | 0.79 | 16.42 |
| 2010 | 101,629 | 22.80 | 0.87 | 9.17 |
| 2011 | 117,561 | 15.68 | 0.91 | 4.70 |
| 2012 | 138,027 | 17.41 | 0.88 | -2.91 |
| 2013 | 153,965 | 11.55 | 0.98 | 10.02 |
| 2014 | 177,366 | 15.20 | 1.07 | 8.41 |
| 2015 | 199,383 | 12.41 | 1.14 | 5.85 |
| 2016 | 207,913 | 4.28 | 1.18 | 3.59 |
| 2017 | 223,271 | 7.39 | 1.29 | 8.55 |
| 2018 | 223,068 | -0.09 | 1.28 | -0.66 |
| 2019 | 224,111 | 0.47 | 1.31 | 2.33 |
| 2020 | 186,625 | -16.73 | 1.27 | -3.59 |
| 2021 | 194,842 | 4.40 | 1.30 | 2.63 |
| 2022 | 177,869 | -8.71 | 1.30 | -0.27 |
| 2023 | 227,158 | 27.71 | 1.46 | 11.12 |
| 2024 | 44,598 | 0.00 | 1.03 | 0.00 |
Audi U.S Annual Sales Units & Growth Chart
Below is a visual representation of Audi’s U.S sales units over time. We have both the Audi sales units and the growth rate in the U.S market. Click on the items in the legend to see each series by itself.
Audi U.S Growth Rate & Market Share Chart
Below is the annual growth rate for the Audi brand in the U.S, shown against the Audi’s marketshare changes in the U.S. This gives you a good look into how Audi has faired against the other brands in terms of absolute sales and effect on marketshare. Click on the items in the legend to see each series by itself.
The Best-Selling Audi Cars & SUVs in the United States
Here are the best-selling Audi cars & SUVs in the United States in 2022. Audi has a wide variety of cars and SUVs to choose from, so there is sure to be one that is right for you. No surprised that Audi’s big sellers are SUVs, making up three of the top 5 best selling vehicles sold by the brand in the U.S.
- Audi Q5 (57,053 units sold in 2022): The Q5 is a mid-size SUV that is known for its stylish design, comfortable ride, and powerful engines. It is available with a variety of engines, including a turbocharged 2.0-liter four-cylinder engine, a turbocharged 3.0-liter V6 engine, and a plug-in hybrid powertrain.
- Audi Q3 (23,045 units sold in 2022): The Q3 is a compact SUV that is known for its fuel efficiency and spacious interior. It is available with a variety of engines, including a turbocharged 2.0-liter four-cylinder engine and a turbocharged 1.4-liter engine.
- Audi A5 (18,349 units sold in 2022): The A5 is a mid-size hatchback that is known for its stylish design and sporty handling. It is available with a variety of engines, including a turbocharged 2.0-liter four-cylinder engine and a turbocharged 3.0-liter V6 engine.
- Audi Q7 (17,887 units sold in 2022): The Q7 is a full-size SUV that is known for its spacious interior and powerful engines. It is available with a variety of engines, including a turbocharged 3.0-liter V6 engine and a turbocharged 4.0-liter V8 engine.
- Audi A4 (15,239 units sold in 2022): The A4 is a compact sedan that is known for its sporty handling and luxurious interior. It is available with a variety of engines, including a turbocharged 2.0-liter four-cylinder engine and a turbocharged 2.0-liter diesel engine.
The Current Audi Model Lineup & Prices in the U.S
It would take ten pages to list every individual Audi model on sale in the U.S right now. So we have grouped them into obvious model buckets. Audi also offers a variety of special editions and performance models, such as the RS Q8, RS Q3, and RS 3. These models are typically more expensive than the standard models and have more performance and other appointments. They are included in the main model to make life a bit easier. Note that below we are talking about just the starting MSRPs for the Audi models. The actual price of an Audi will vary depending on options and dealer markup.
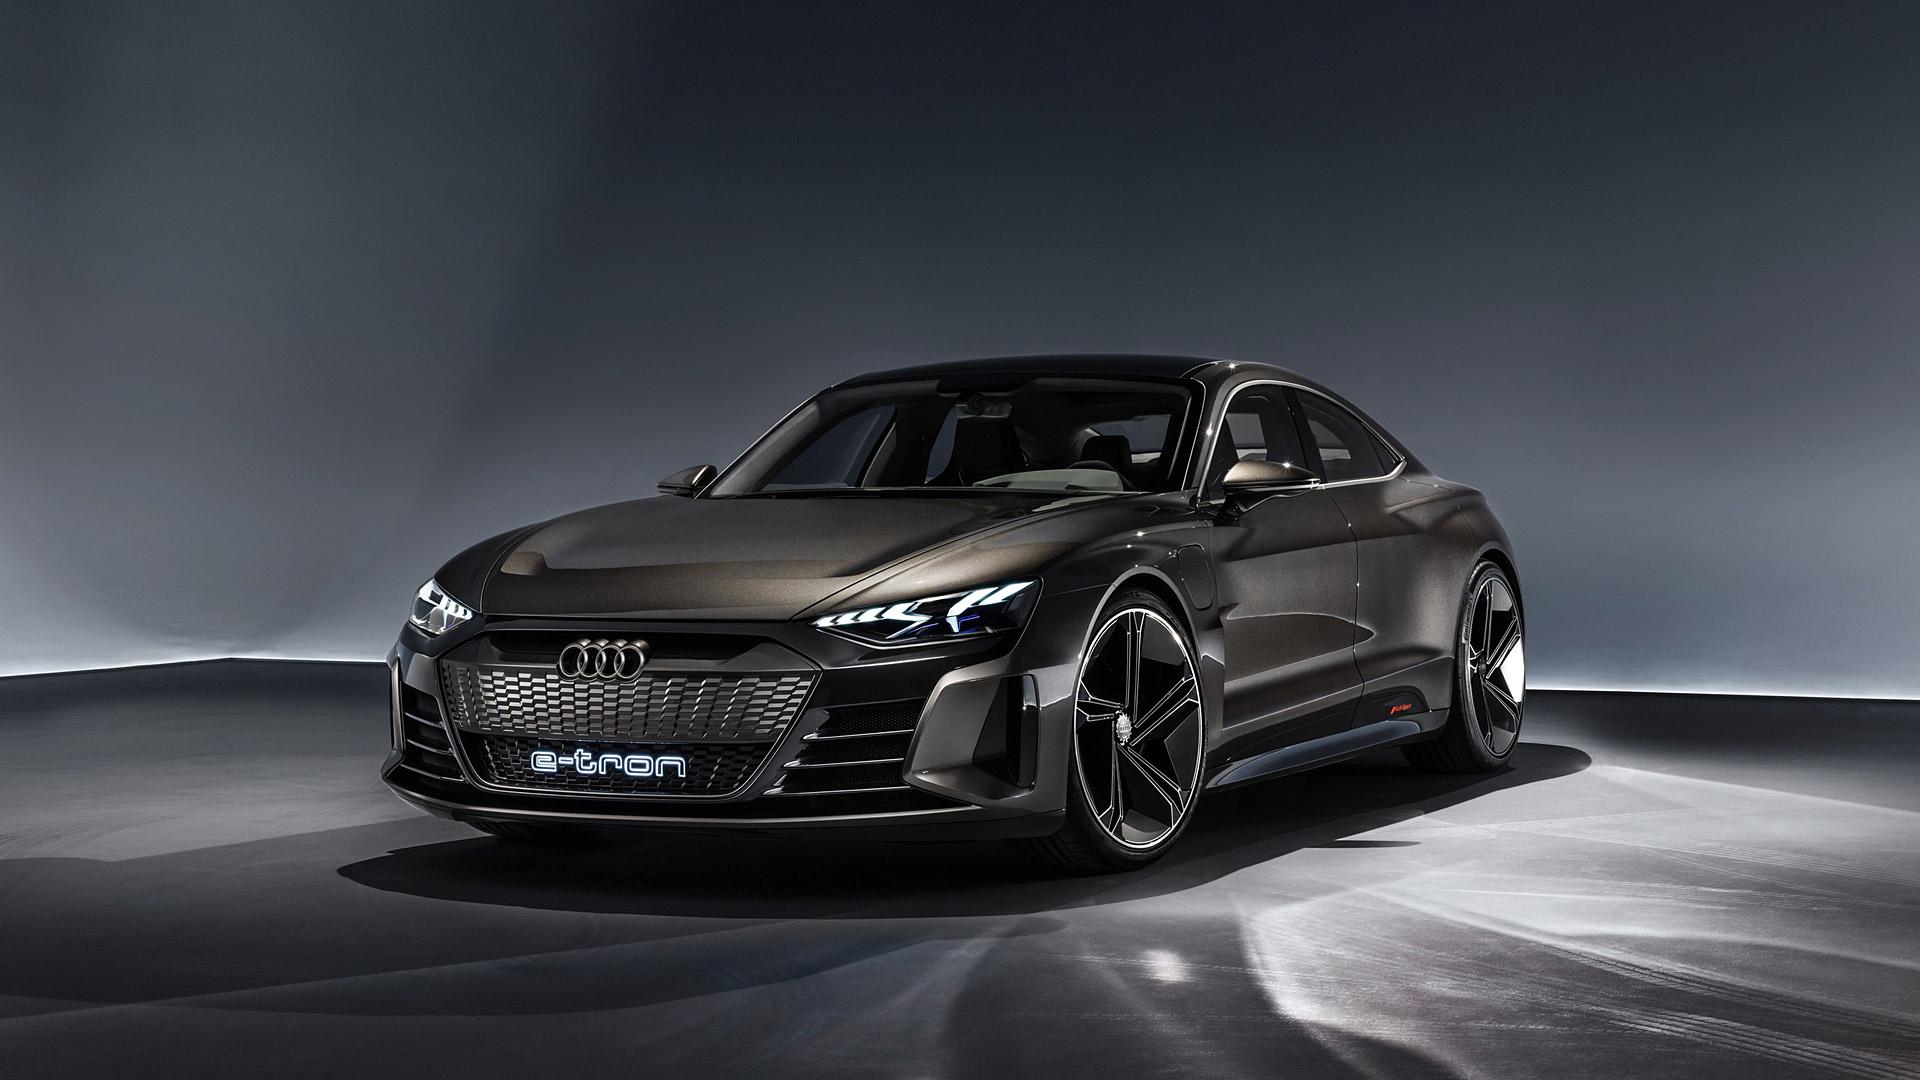
Audi e-tron GT
Base $106,500 / RS $147,500
The Audi e-tron GT is a four-door electric gran turismo that was first released in 2021. It is based on the same platform as the Porsche Taycan, and it shares many of the same components. The e-tron GT is available in two models: the e-tron GT quattro and the RS e-tron GT. The e-tron GT quattro has a dual-motor powertrain that produces 469 horsepower and 464 pound-feet of torque. It can go from 0 to 60 mph in 3.9 seconds and has a top speed of 155 mph. The RS e-tron GT has a more powerful dual-motor powertrain that produces 637 horsepower and 612 pound-feet of torque. It can go from 0 to 60 mph in 3.1 seconds and has a top speed of 162 mph.
Both models of the e-tron GT have a 93.4-kWh battery pack that provides an EPA-estimated range of 238 miles for the e-tron GT quattro and 232 miles for the RS e-tron GT. The e-tron GT is equipped with a standard 800-volt charging system that can charge the battery from 5% to 80% in about 22 minutes. It also supports DC fast charging up to 270 kW. The e-tron GT is a stylish and luxurious electric car that offers a combination of performance, range, and technology. It is a direct competitor to the Porsche Taycan, and it is one of the most compelling electric cars on the market.
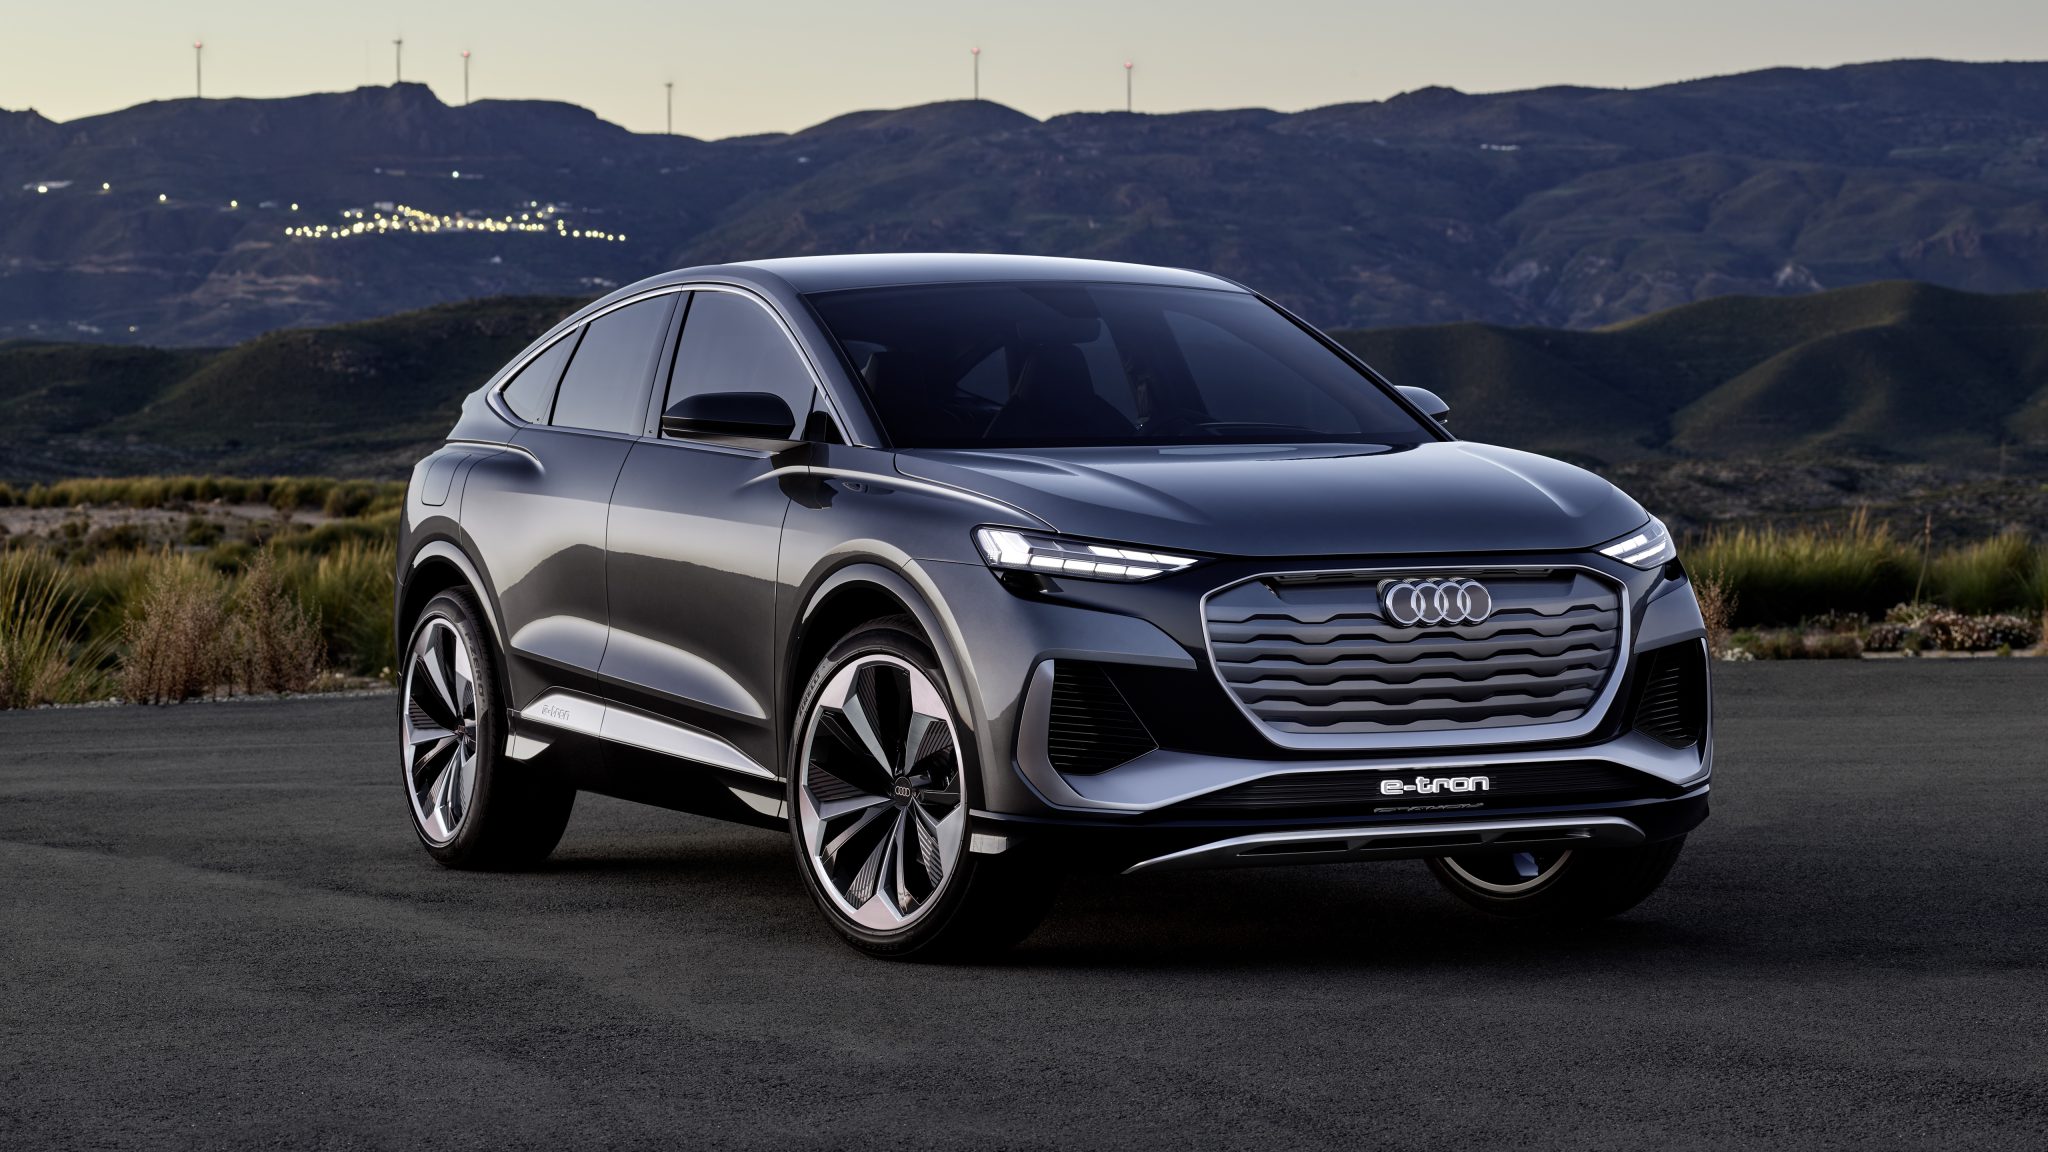
Audi Q4 e-tron
Base $49,800 / Sportback $58,200
The Audi Q4 e-tron is a compact electric SUV that was first released in 2022. It is based on the Volkswagen MEB platform, and it shares many of the same components with the Volkswagen ID.4. The Q4 e-tron is available in two models: the 40 e-tron and the 50 e-tron. The 40 e-tron has a rear-mounted electric motor that produces 201 horsepower and 229 pound-feet of torque. It can go from 0 to 60 mph in 7.9 seconds and has a top speed of 99 mph. The 50 e-tron has a dual-motor all-wheel drive powertrain that produces 295 horsepower and 339 pound-feet of torque. It can go from 0 to 60 mph in 6.2 seconds and has a top speed of 112 mph.
Both models of the Q4 e-tron have a 77.0-kWh battery pack that provides an EPA-estimated range of 241 miles for the 40 e-tron and 236 miles for the 50 e-tron. The Q4 e-tron is equipped with a standard 11 kW onboard charger that can charge the battery from empty to full in about 8.5 hours. It also supports DC fast charging up to 125 kW. The Q4 e-tron is a stylish and practical electric SUV that offers a combination of range, performance, and technology. It is a direct competitor to the Tesla Model Y and the Volkswagen ID.4.
The Q4 e-tron starts at $49,800 for the 40 e-tron and $55,200 for the 50 e-tron.
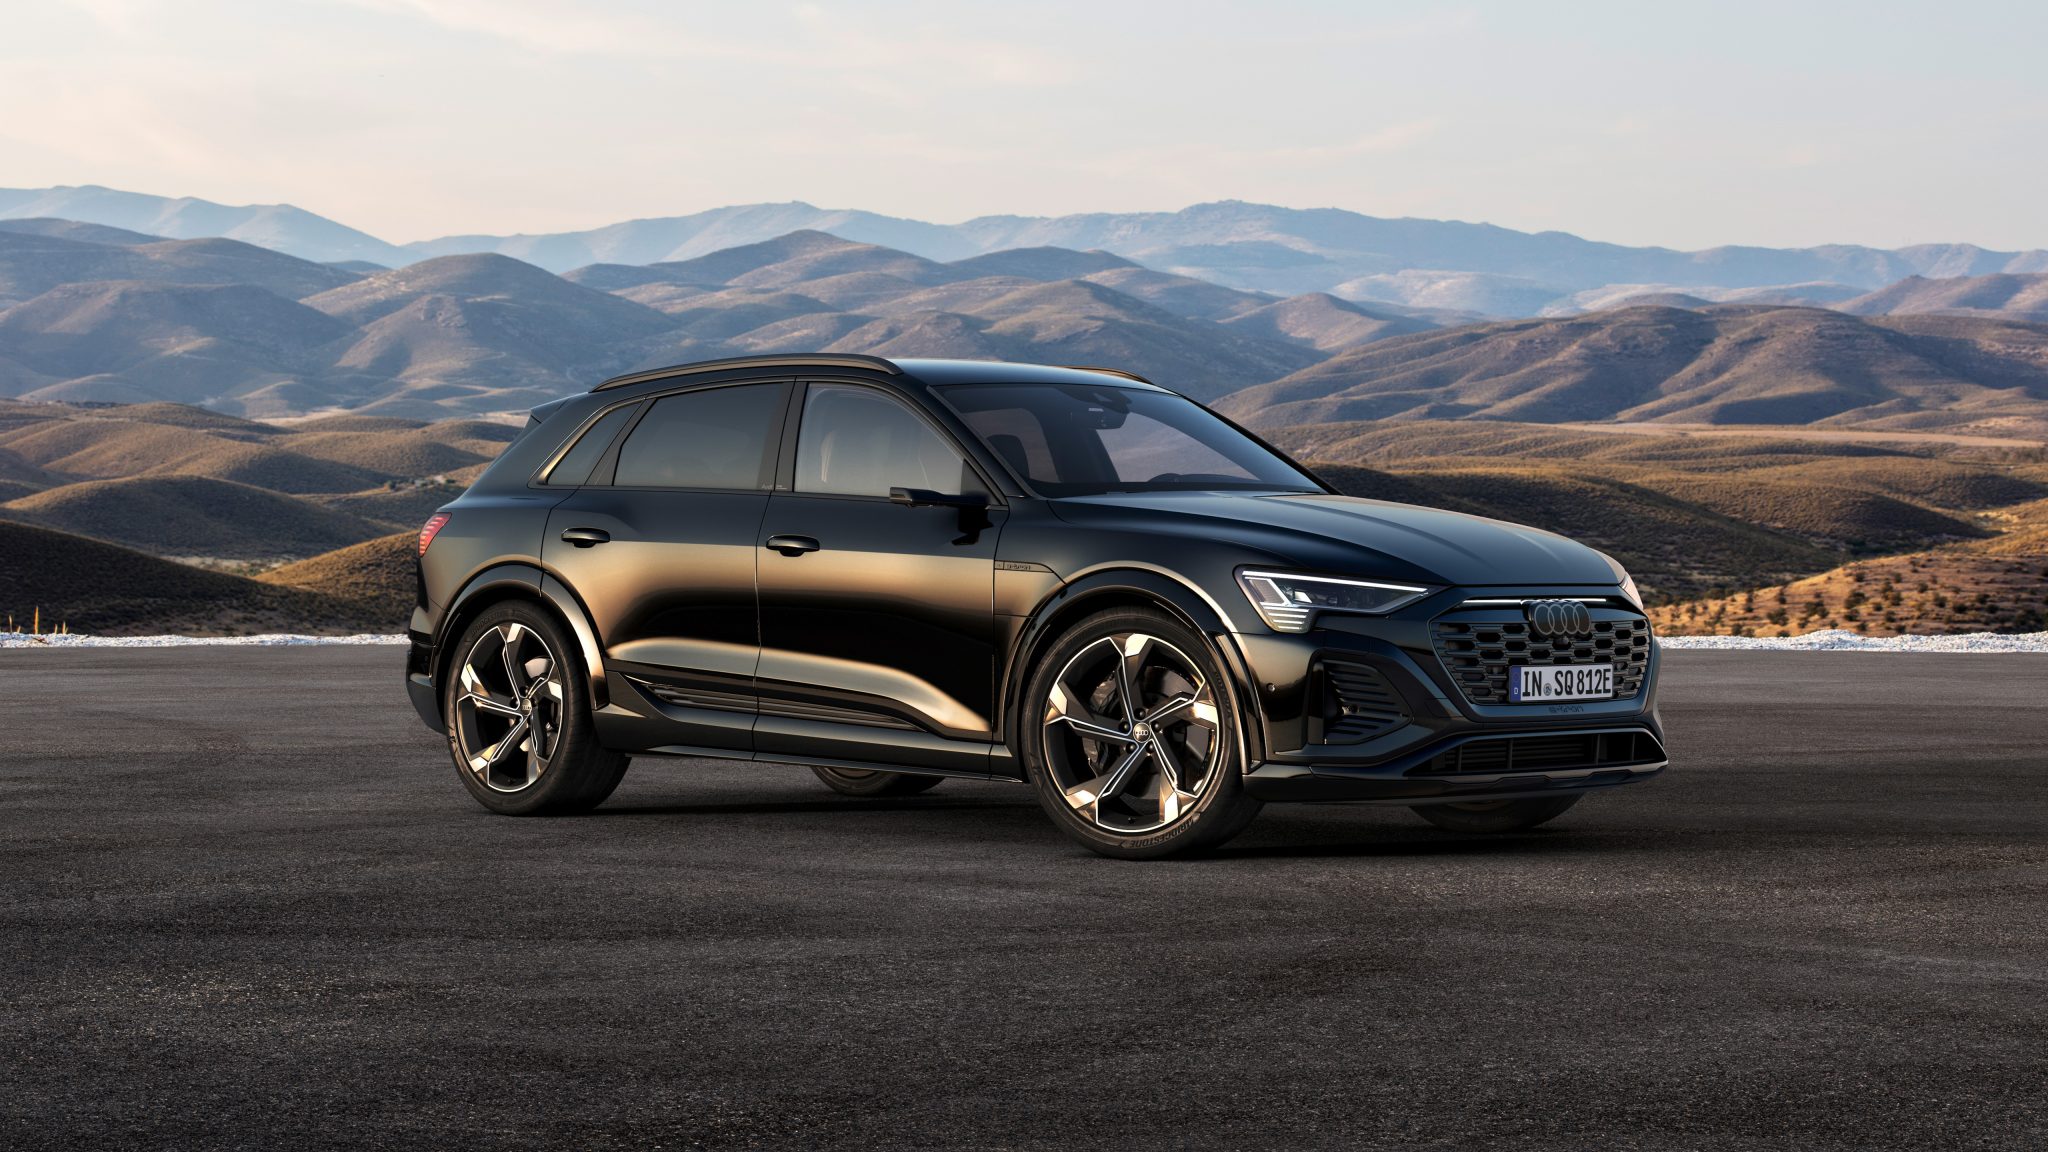
Audi Q8 e-tron
Base $74,400 / Sportback $77,800 / SQ8: $89,800 / SQ8 Sportback: $92,600
The Audi Q8 e-tron is a luxury electric SUV that was first released in 2023. It is based on the same platform as the Porsche Taycan Cross Turismo, and it shares many of the same components. The Q8 e-tron is available in two models: the Q8 e-tron 50 and the Q8 e-tron 55. The Q8 e-tron 50 has a dual-motor powertrain that produces 362 horsepower and 462 pound-feet of torque. It can go from 0 to 60 mph in 5.7 seconds and has a top speed of 130 mph.
The Q8 e-tron 55 has a more powerful dual-motor powertrain that produces 496 horsepower and 561 pound-feet of torque. It can go from 0 to 60 mph in 4.9 seconds and has a top speed of 140 mph. Both models of the Q8 e-tron have a 114 kWh battery pack that provides an EPA-estimated range of 285 miles for the Q8 e-tron 50 and 265 miles for the Q8 e-tron 55.
The Q8 e-tron is equipped with a standard 11 kW onboard charger that can charge the battery from empty to full in about 8.5 hours. It also supports DC fast charging up to 170 kW. The Q8 e-tron is a stylish and luxurious electric SUV that offers a combination of performance, range, and technology. It is a direct competitor to the Tesla Model X and the Mercedes-Benz EQC.
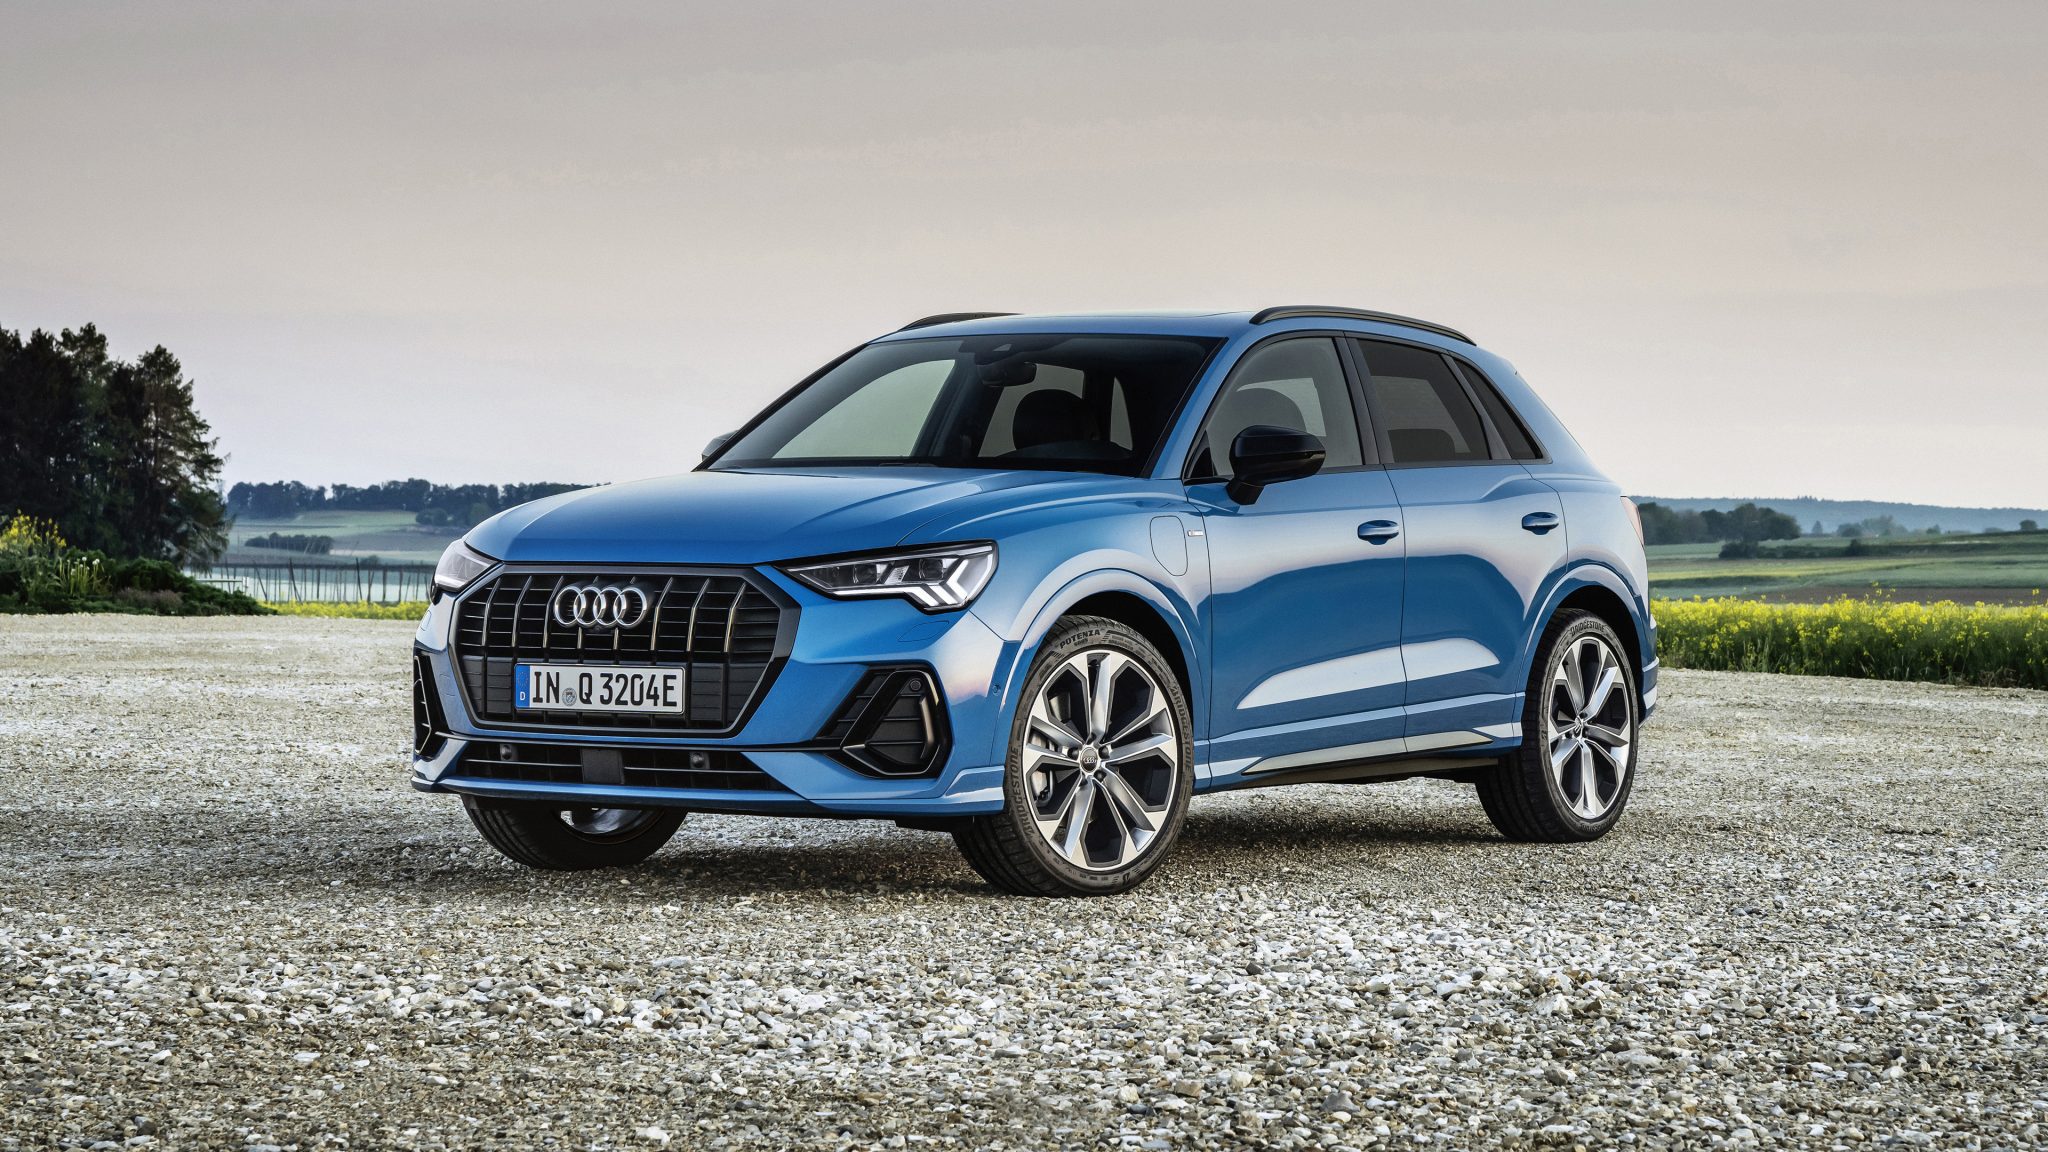
Audi Q3
The Audi Q3 is a compact luxury SUV that was first released in 2011. It is the smallest SUV in Audi’s lineup and is positioned below the Q5 and Q7. The Q3 is available in two trim levels: Premium and Premium Plus. Both trims come standard with a turbocharged 2.0-liter four-cylinder engine that produces 181 horsepower and 221 pound-feet of torque. It is mated to an eight-speed automatic transmission and all-wheel drive.
The Q3 can go from 0 to 60 mph in 7.4 seconds and has a top speed of 130 mph. It gets an EPA-estimated 22 mpg in the city and 31 mpg on the highway. The Q3 comes standard with a variety of features, including a 10.25-inch digital instrument cluster, a 10.1-inch touchscreen infotainment system, Apple CarPlay and Android Auto, a rearview camera, and a sunroof. Available features include a Bang & Olufsen sound system, a head-up display, a panoramic sunroof, and a wireless charging pad.
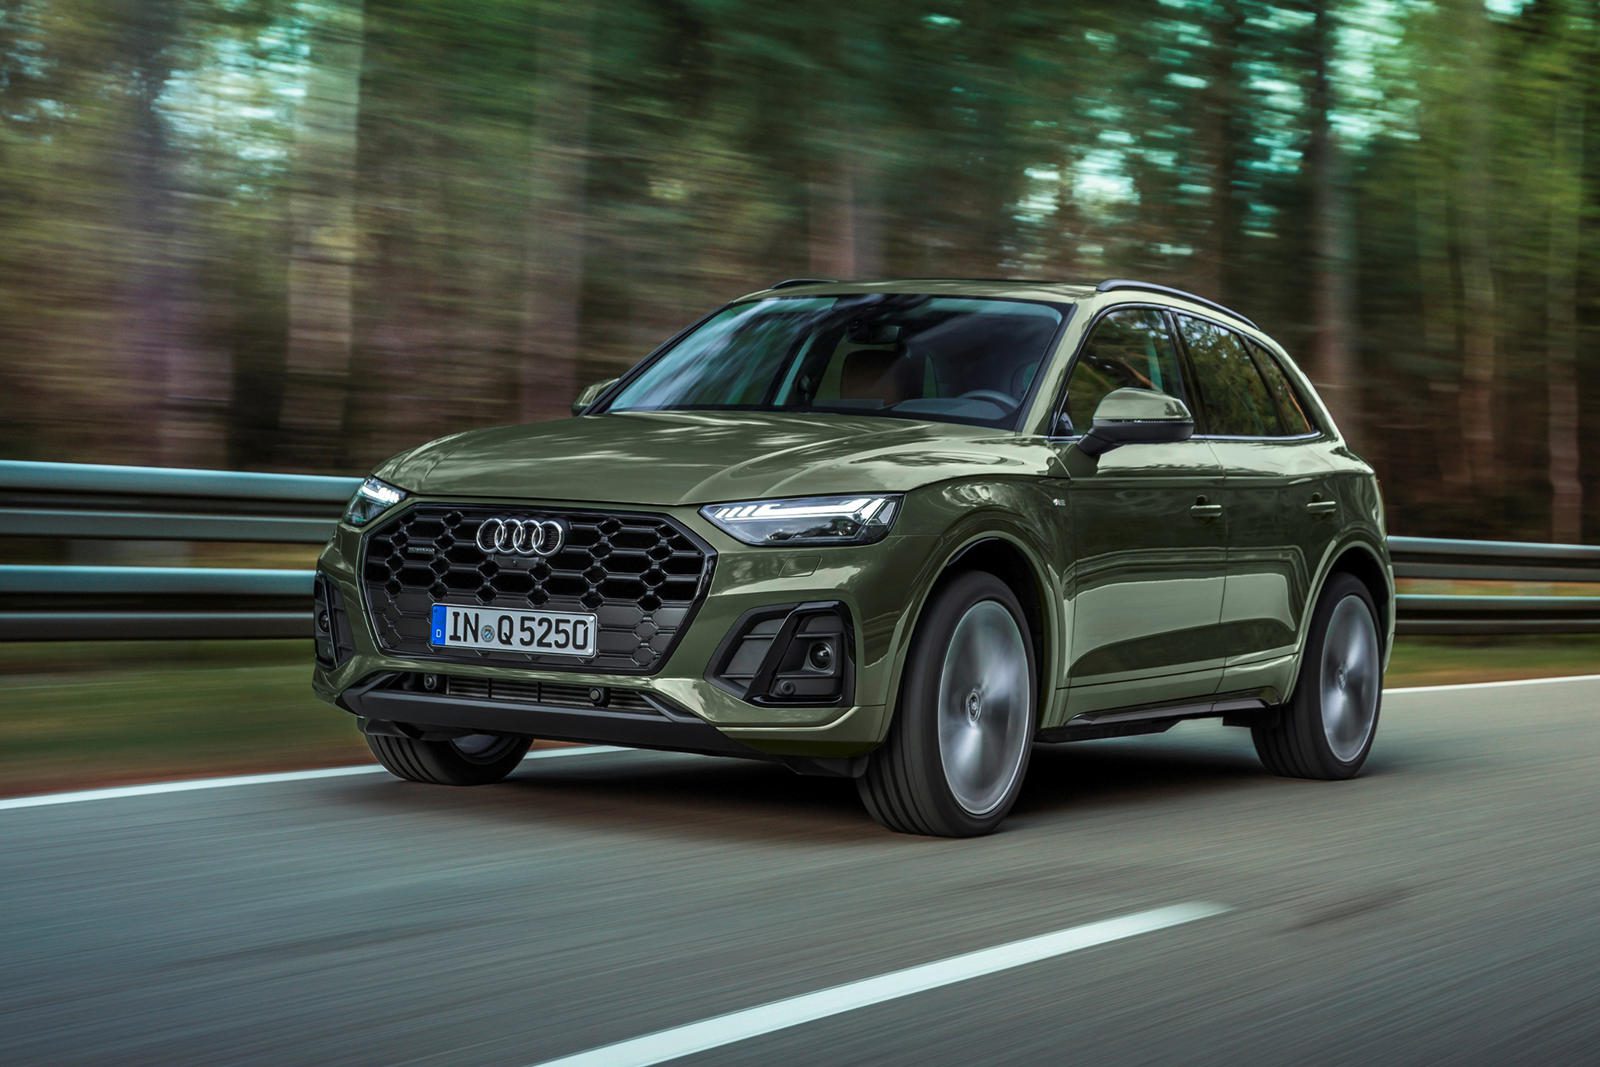
Audi Q5
Base: $44,200 / Q5 Sportback: $51,000 /SQ5: $56,500 / SQ5 Sportback: $59,900
The Audi Q5 is a midsize luxury SUV that was first released in 2008. It is the best selling vehicle in Audi’s lineup. The Q5 is available in four trim levels: Premium, Premium Plus, S line, and SQ5. The Premium trim comes standard with a turbocharged 2.0-liter four-cylinder engine that produces 201 horsepower and 221 pound-feet of torque. It is mated to an eight-speed automatic transmission and all-wheel drive. The Q5 can go from 0 to 60 mph in 7.4 seconds for the base engine, 5.7 seconds for the S line, and 5.0 seconds for the SQ5. It gets an EPA-estimated 22 mpg in the city and 31 mpg on the highway for the base engine, 21 mpg in the city and 29 mpg on the highway for the S line, and 19 mpg in the city and 27 mpg on the highway for the SQ5.
The Q5 comes standard with a variety of features, including a 10.25-inch digital instrument cluster, a 10.1-inch touchscreen infotainment system, Apple CarPlay and Android Auto, a rearview camera, and a sunroof. Available features include a Bang & Olufsen sound system, a head-up display, a panoramic sunroof, and a wireless charging pad.
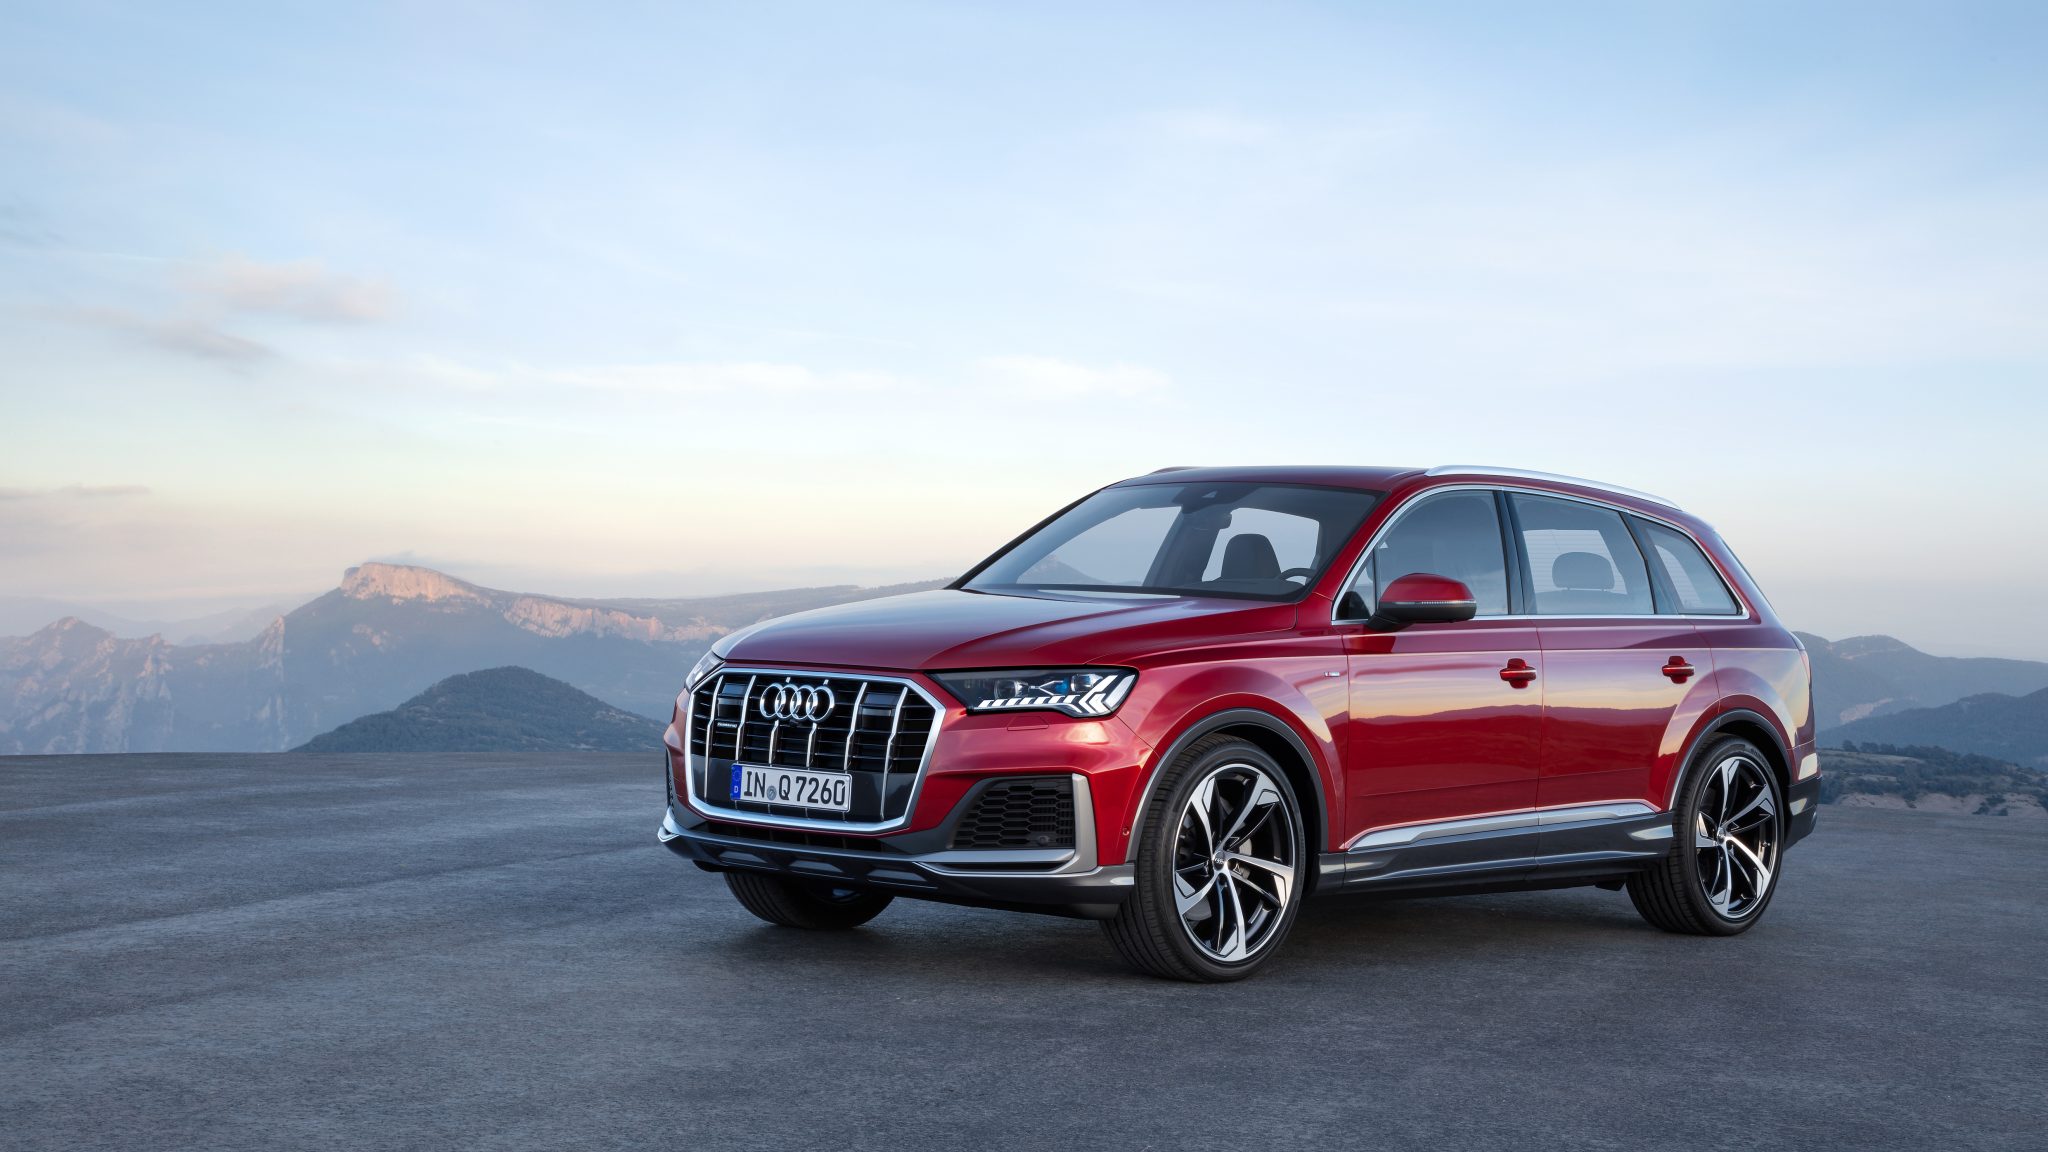
Audi Q7
Base: $59,200 / SQ7: $90,200
The Audi Q7 is a full-size luxury SUV that was first released in 2006. It is the largest SUV in Audi’s lineup and is positioned above the Q5 and Q8. The Q7 is available in three trim levels: Premium, Premium Plus, and Prestige. The Premium trim comes standard with a turbocharged 2.0-liter four-cylinder engine that produces 261 horsepower and 273 pound-feet of torque. It is mated to an eight-speed automatic transmission and all-wheel drive.
The Premium Plus trim adds features such as a panoramic sunroof, a Bang & Olufsen sound system, and a head-up display. The Prestige trim adds even more features, such as a 12.3-inch digital instrument cluster, a 10.1-inch touchscreen infotainment system, and a four-zone climate control system. The Q7 can go from 0 to 60 mph in 6.9 seconds for the base engine. It gets an EPA-estimated 21 mpg in the city and 29 mpg on the highway.
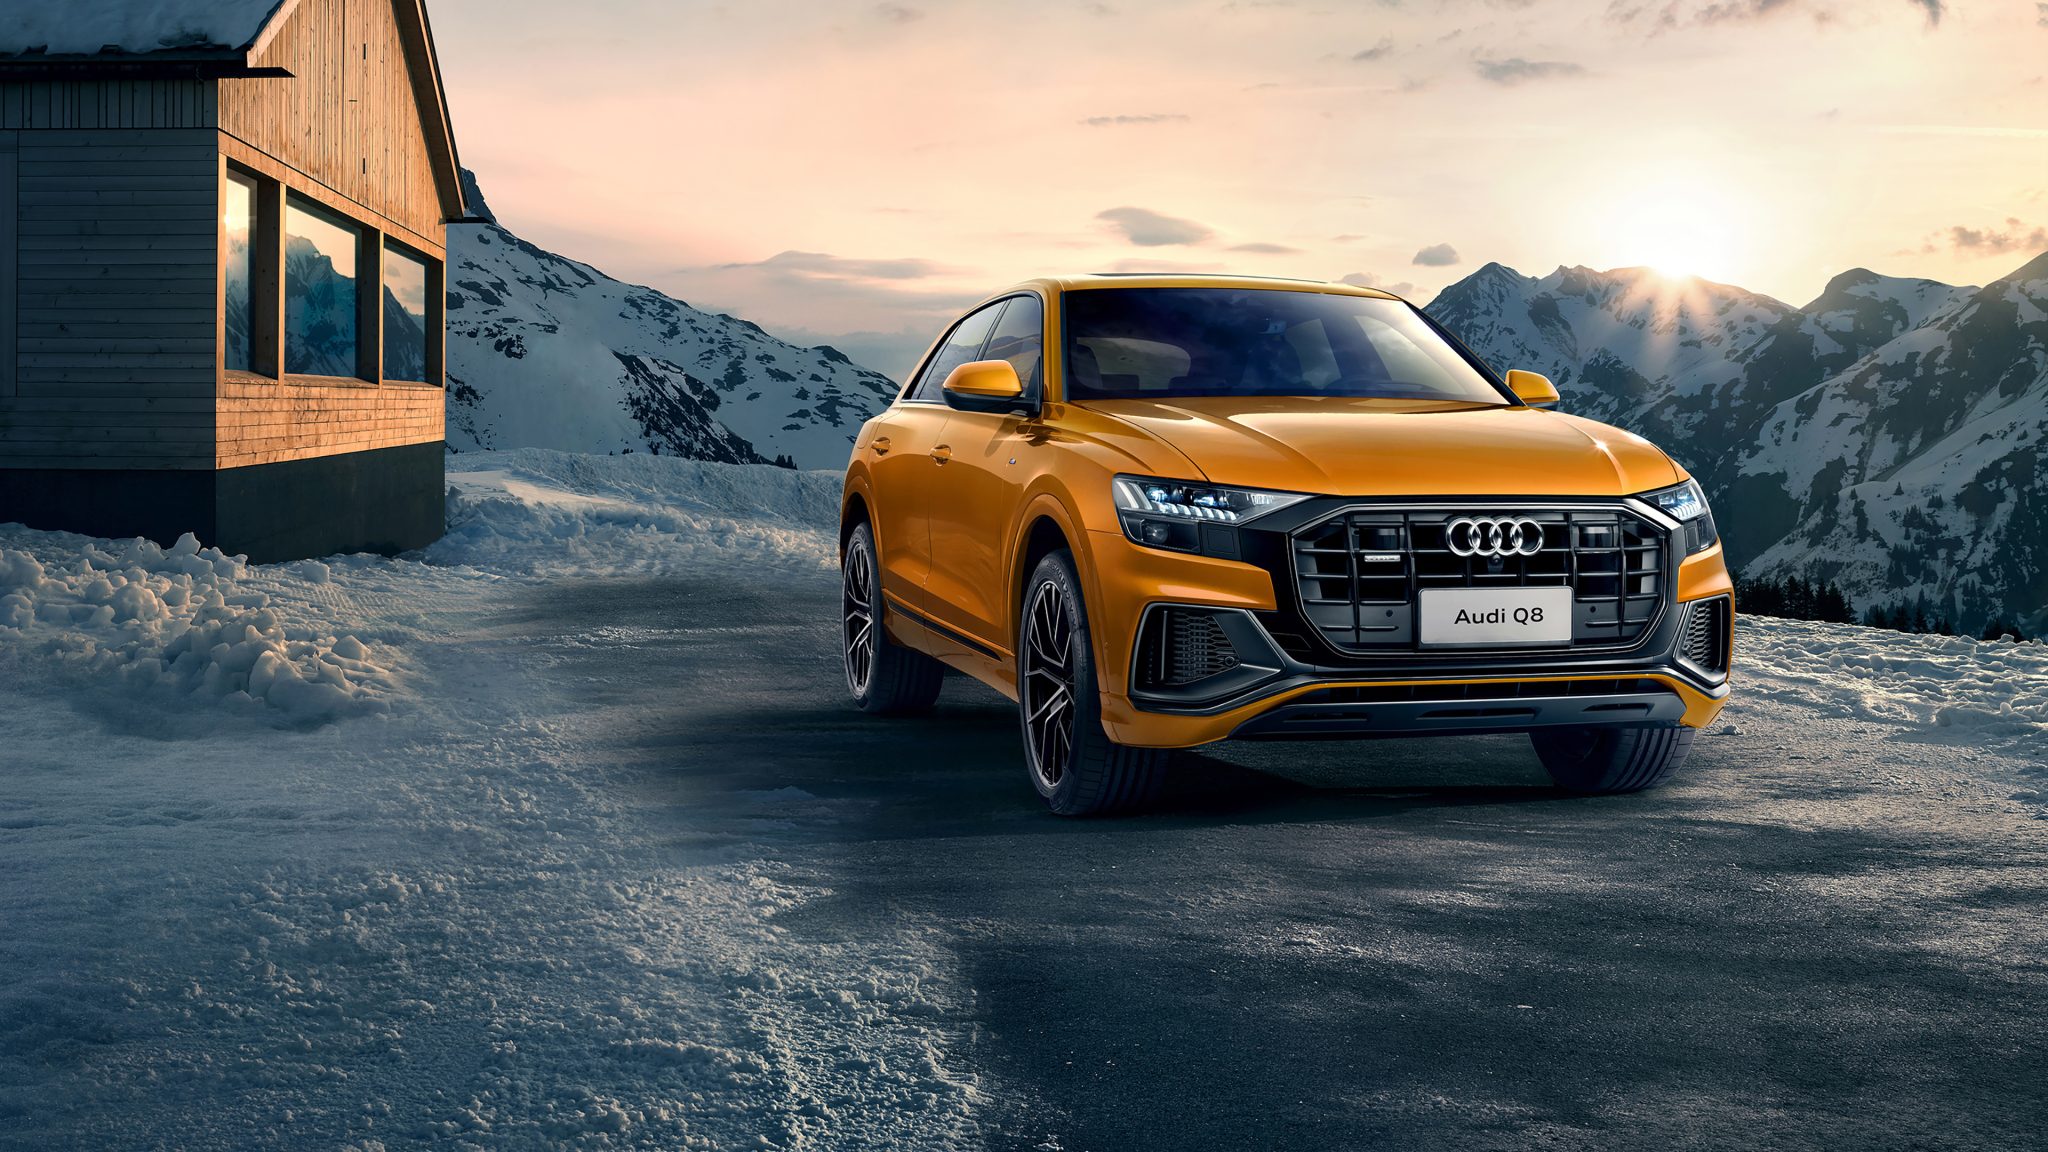
Audi Q8
Base: $ 72,800 / SQ8: $95,500 / RS Q8: $125,800
The Audi Q8 is a luxury SUV that was first released in 2018. It is a more stylish and athletic version of the Q7 and is positioned above it in Audi’s lineup. The Q8 is available in two trim levels: Premium and Prestige. The Premium trim comes standard with a turbocharged 3.0-liter V6 engine that produces 335 horsepower and 369 pound-feet of torque. It is mated to an eight-speed automatic transmission and all-wheel drive. The Prestige trim adds features such as a panoramic sunroof, a Bang & Olufsen sound system, and a head-up display. The Q8 can go from 0 to 60 mph in 5.8 seconds. It gets an EPA-estimated 19 mpg in the city and 27 mpg on the highway.
The current Audi SQ8 and RS Q8 are both performance versions of the Q8 SUV. The SQ8 is powered by a turbocharged 3.0-liter V6 engine that produces 362 horsepower and 369 pound-feet of torque. It is mated to an eight-speed automatic transmission and all-wheel drive. The RS Q8 is powered by a twin-turbocharged 4.0-liter V8 engine that produces 591 horsepower and 590 pound-feet of torque. It is also mated to an eight-speed automatic transmission and all-wheel drive.
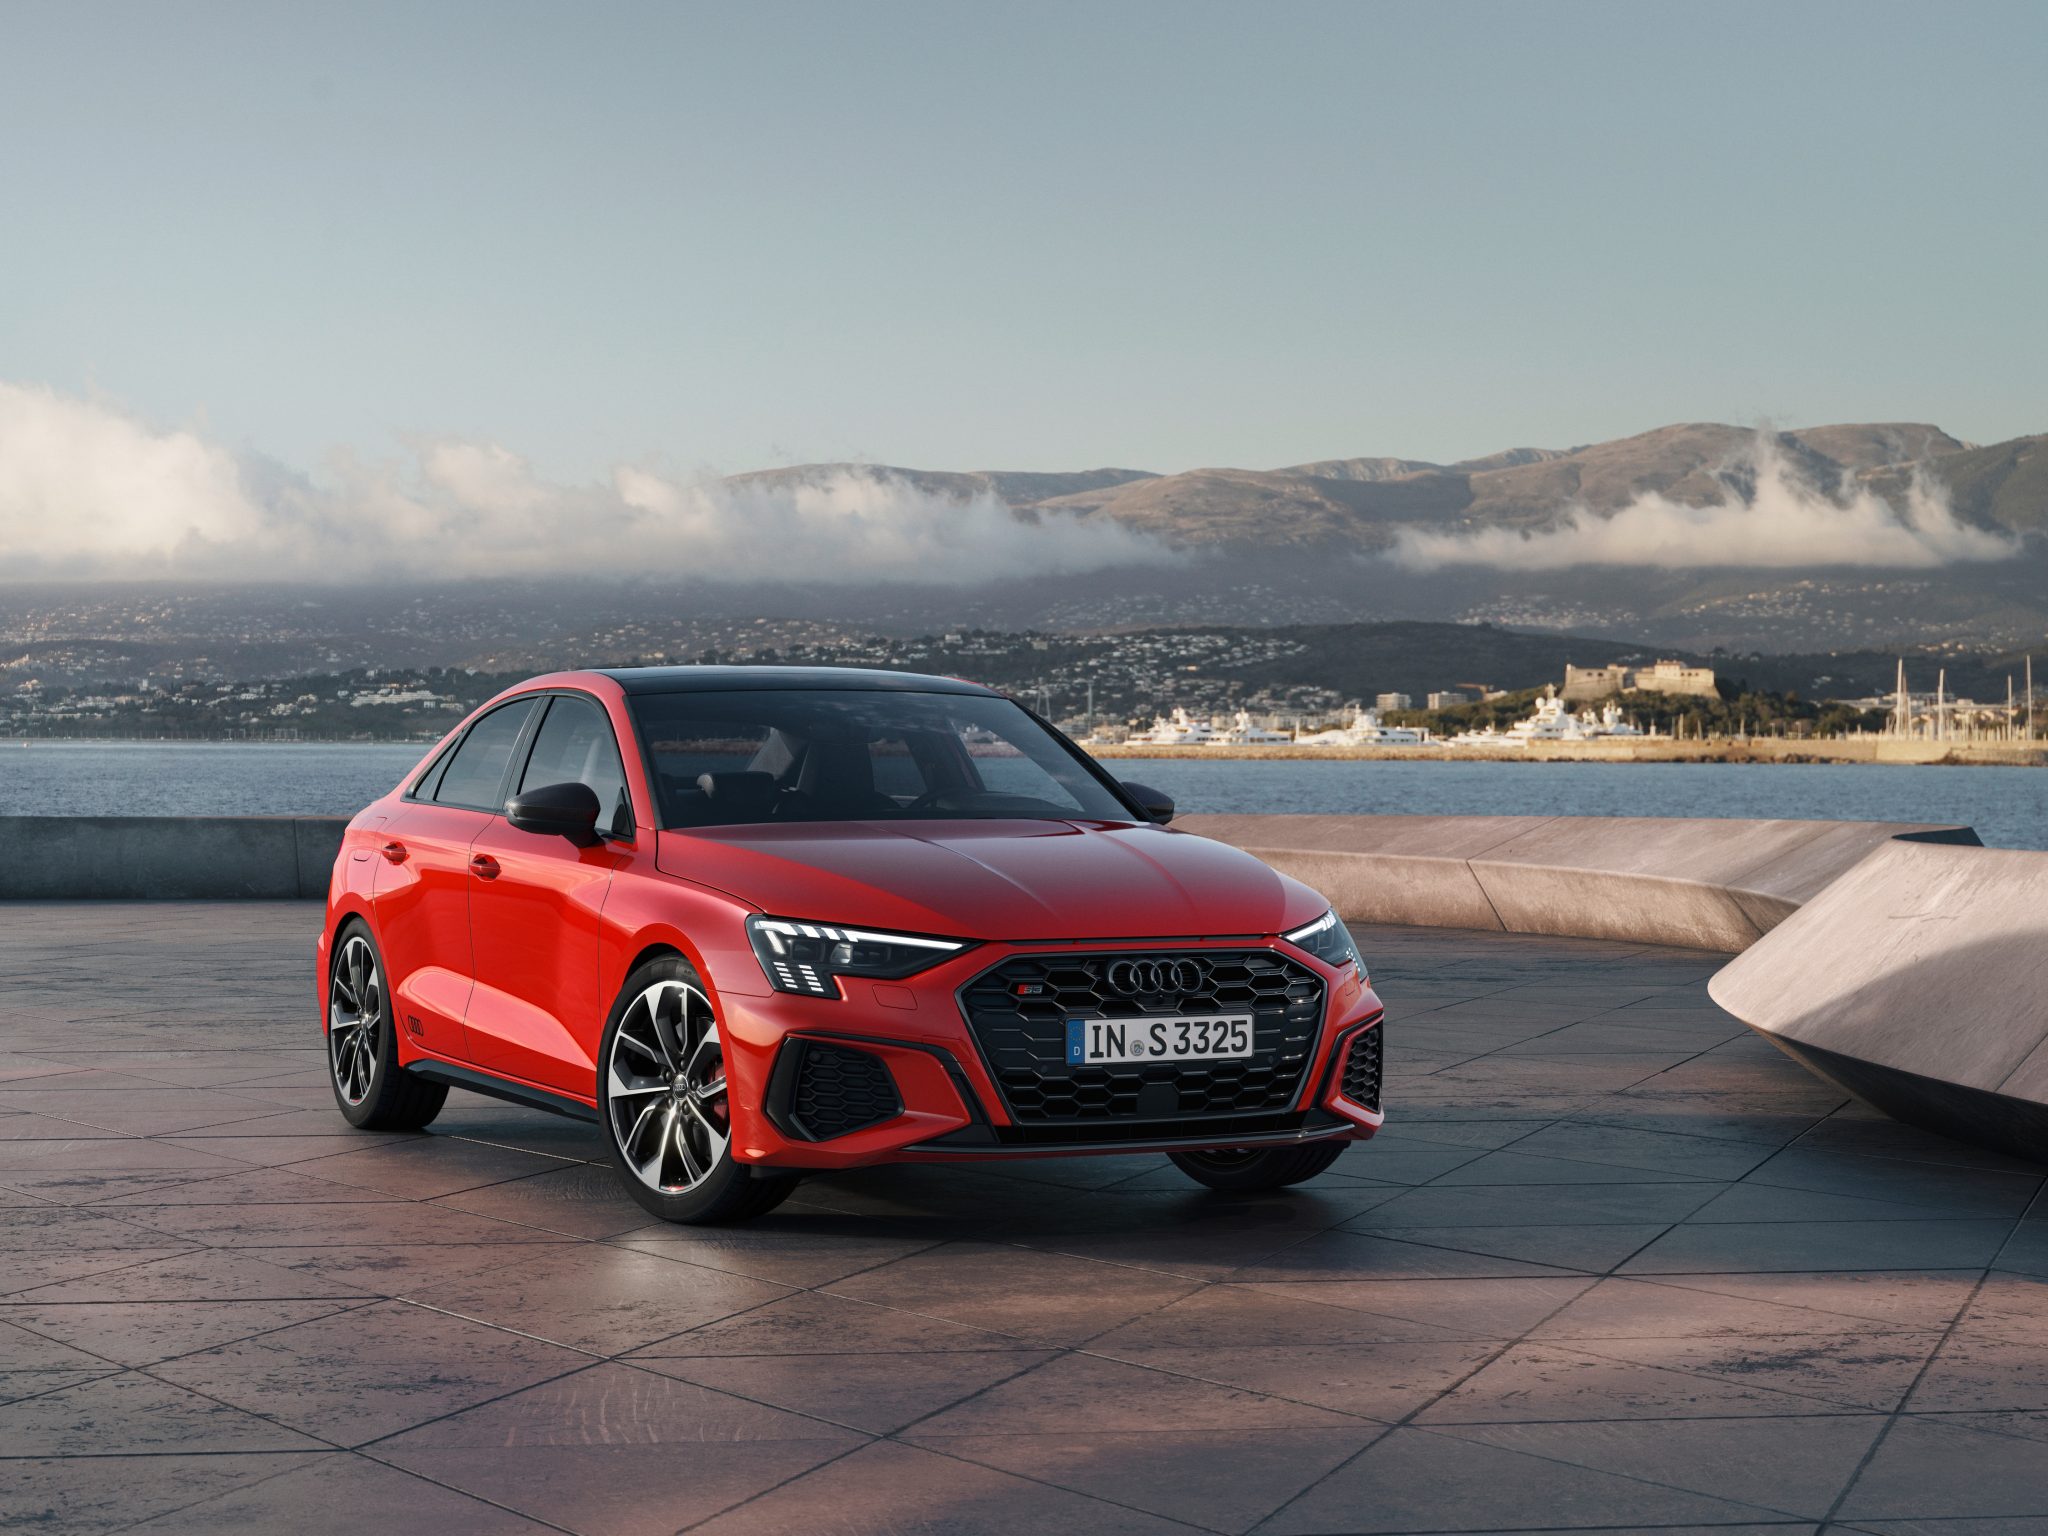
Audi A3
Base: $35,400 / S3: $47,000 / RS 3: $61,700
The Audi A3 is a compact luxury car that was first released in 1996. It is the smallest car in Audi’s lineup and is positioned below the A4. The A3 is available in two body styles: sedan and hatchback. The sedan is available in three trim levels: Premium, Premium Plus, and S line. The hatchback is available in two trim levels: Premium and Premium Plus.
The Premium trim comes standard with a turbocharged 2.0-liter four-cylinder engine that produces 181 horsepower and 221 pound-feet of torque. It is mated to an eight-speed automatic transmission and front-wheel drive. All-wheel drive is available as an option. The Premium Plus trim adds features such as a panoramic sunroof, a Bang & Olufsen sound system, and a head-up display. The S line trim adds sportier exterior styling and a more aggressive suspension.
The current Audi S3 and RS3 are both performance versions of the A3. The S3 is powered by a turbocharged 2.0-liter four-cylinder engine that produces 292 horsepower and 280 pound-feet of torque. It is mated to a seven-speed dual-clutch automatic transmission and all-wheel drive. The RS3 is powered by a turbocharged 2.5-liter five-cylinder engine that produces 401 horsepower and 369 pound-feet of torque. It is also mated to a seven-speed dual-clutch automatic transmission and all-wheel drive.
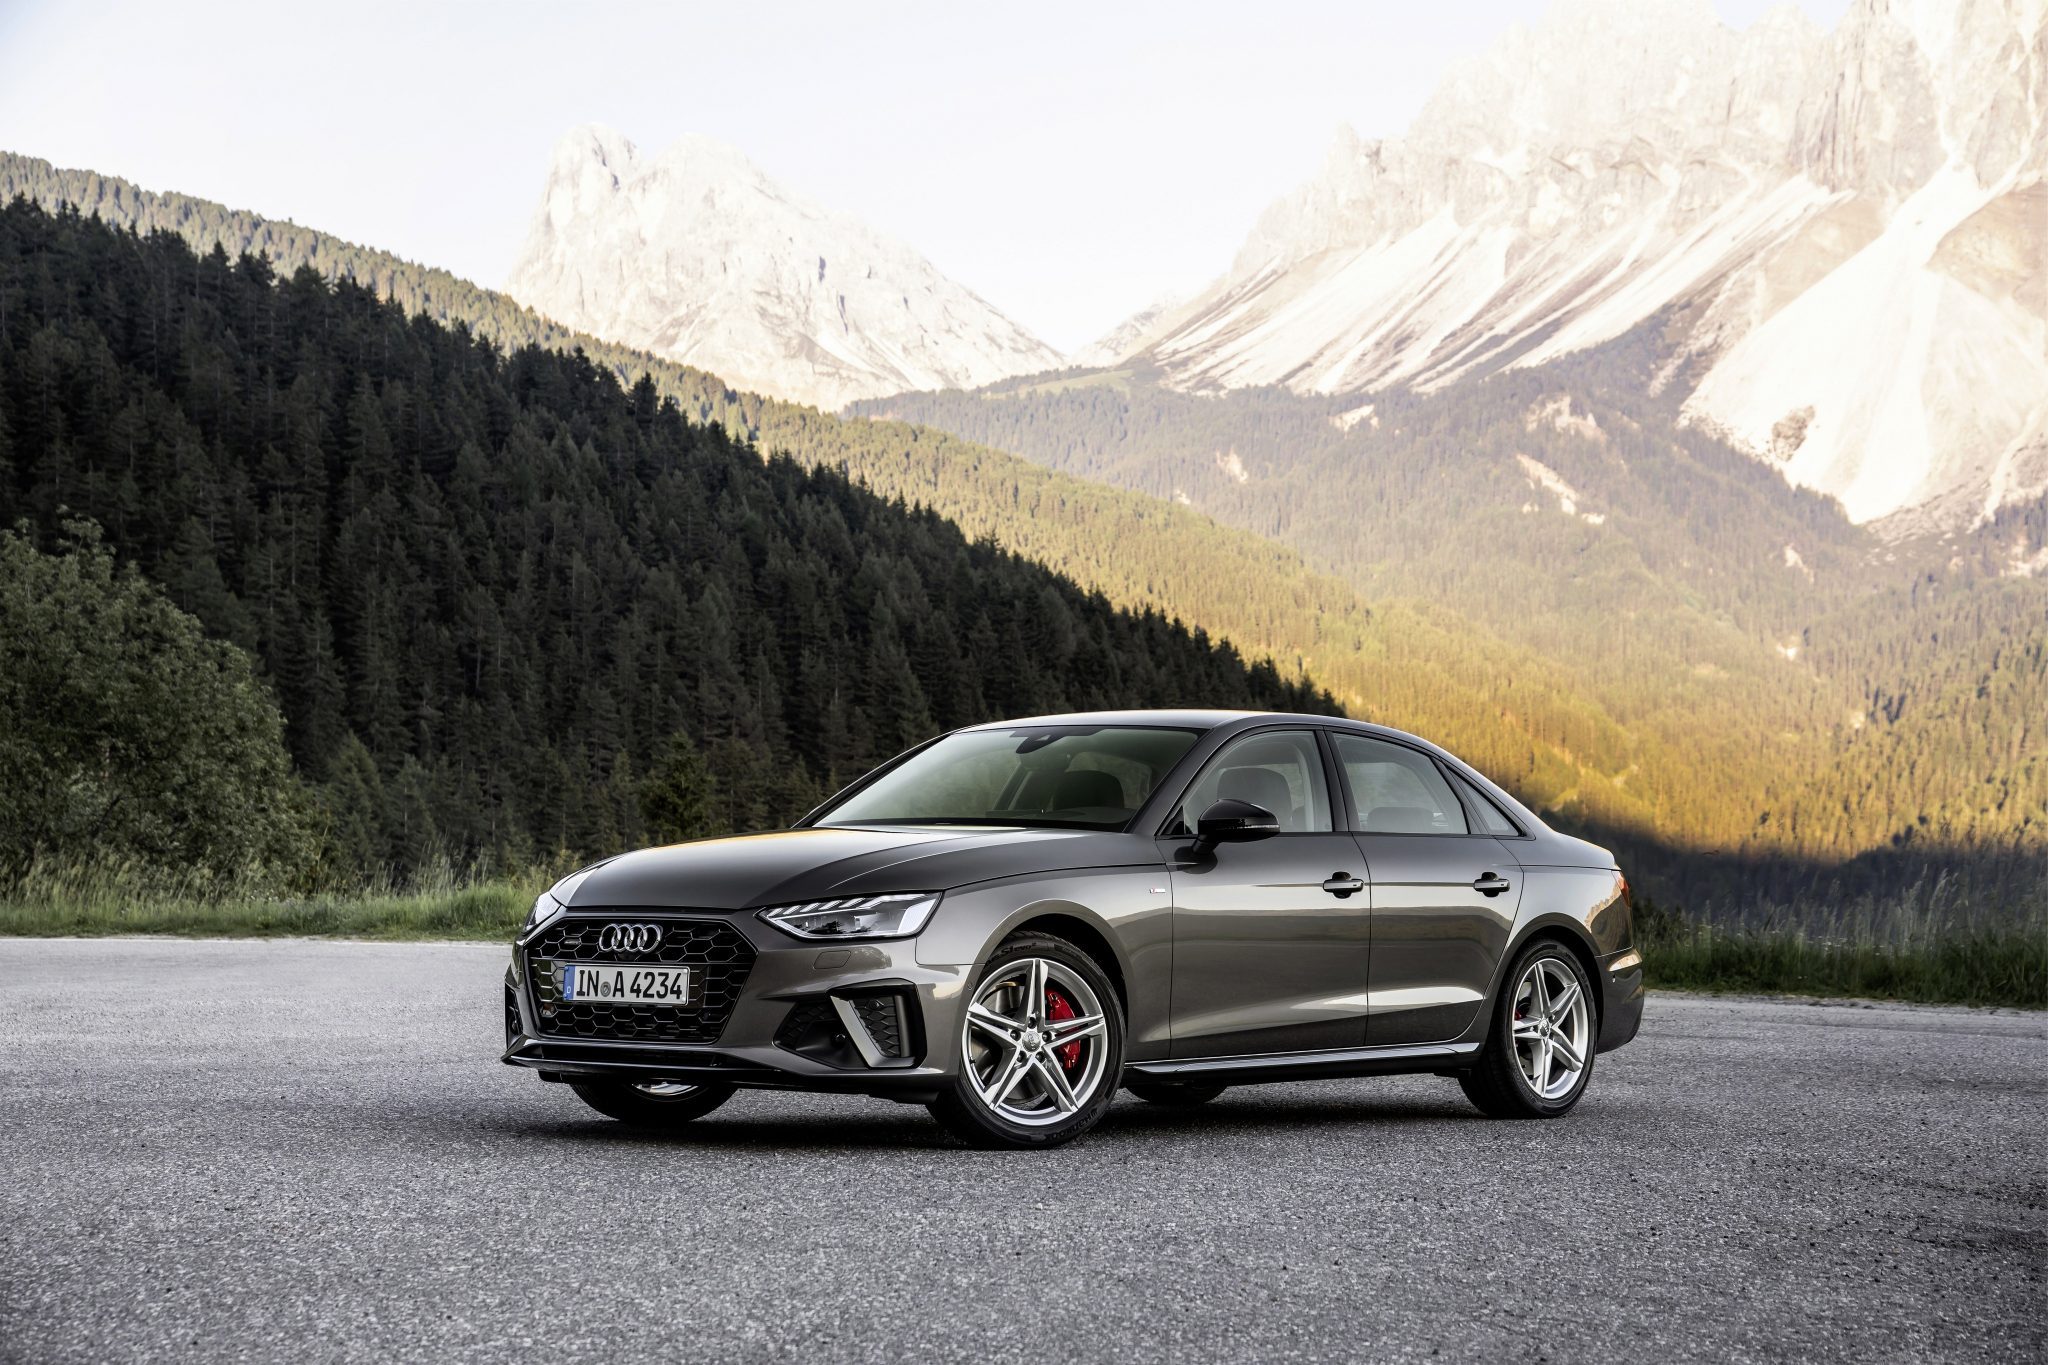
Audi A4
Base: $41,200 / A4 allroad: $44,900 / S4: $53,800
The Audi A4 is a mid-size luxury car that was first released in 1994. It is the best-selling sedan in Audi’s lineup and is positioned below the A6. The A4 is available in two body styles: sedan and Avant (wagon). The sedan is available in four trim levels: Premium, Premium Plus, S line, and Prestige. The Avant is available in three trim levels: Premium, Premium Plus, and Prestige.
The current Audi S4 is a performance version of the A4. It is powered by a turbocharged 3.0-liter V6 engine that produces 354 horsepower and 369 pound-feet of torque. It is mated to an eight-speed automatic transmission and all-wheel drive. The S4 can go from 0 to 60 mph in 4.7 seconds. It gets an EPA-estimated 22 mpg in the city and 31 mpg on the highway.
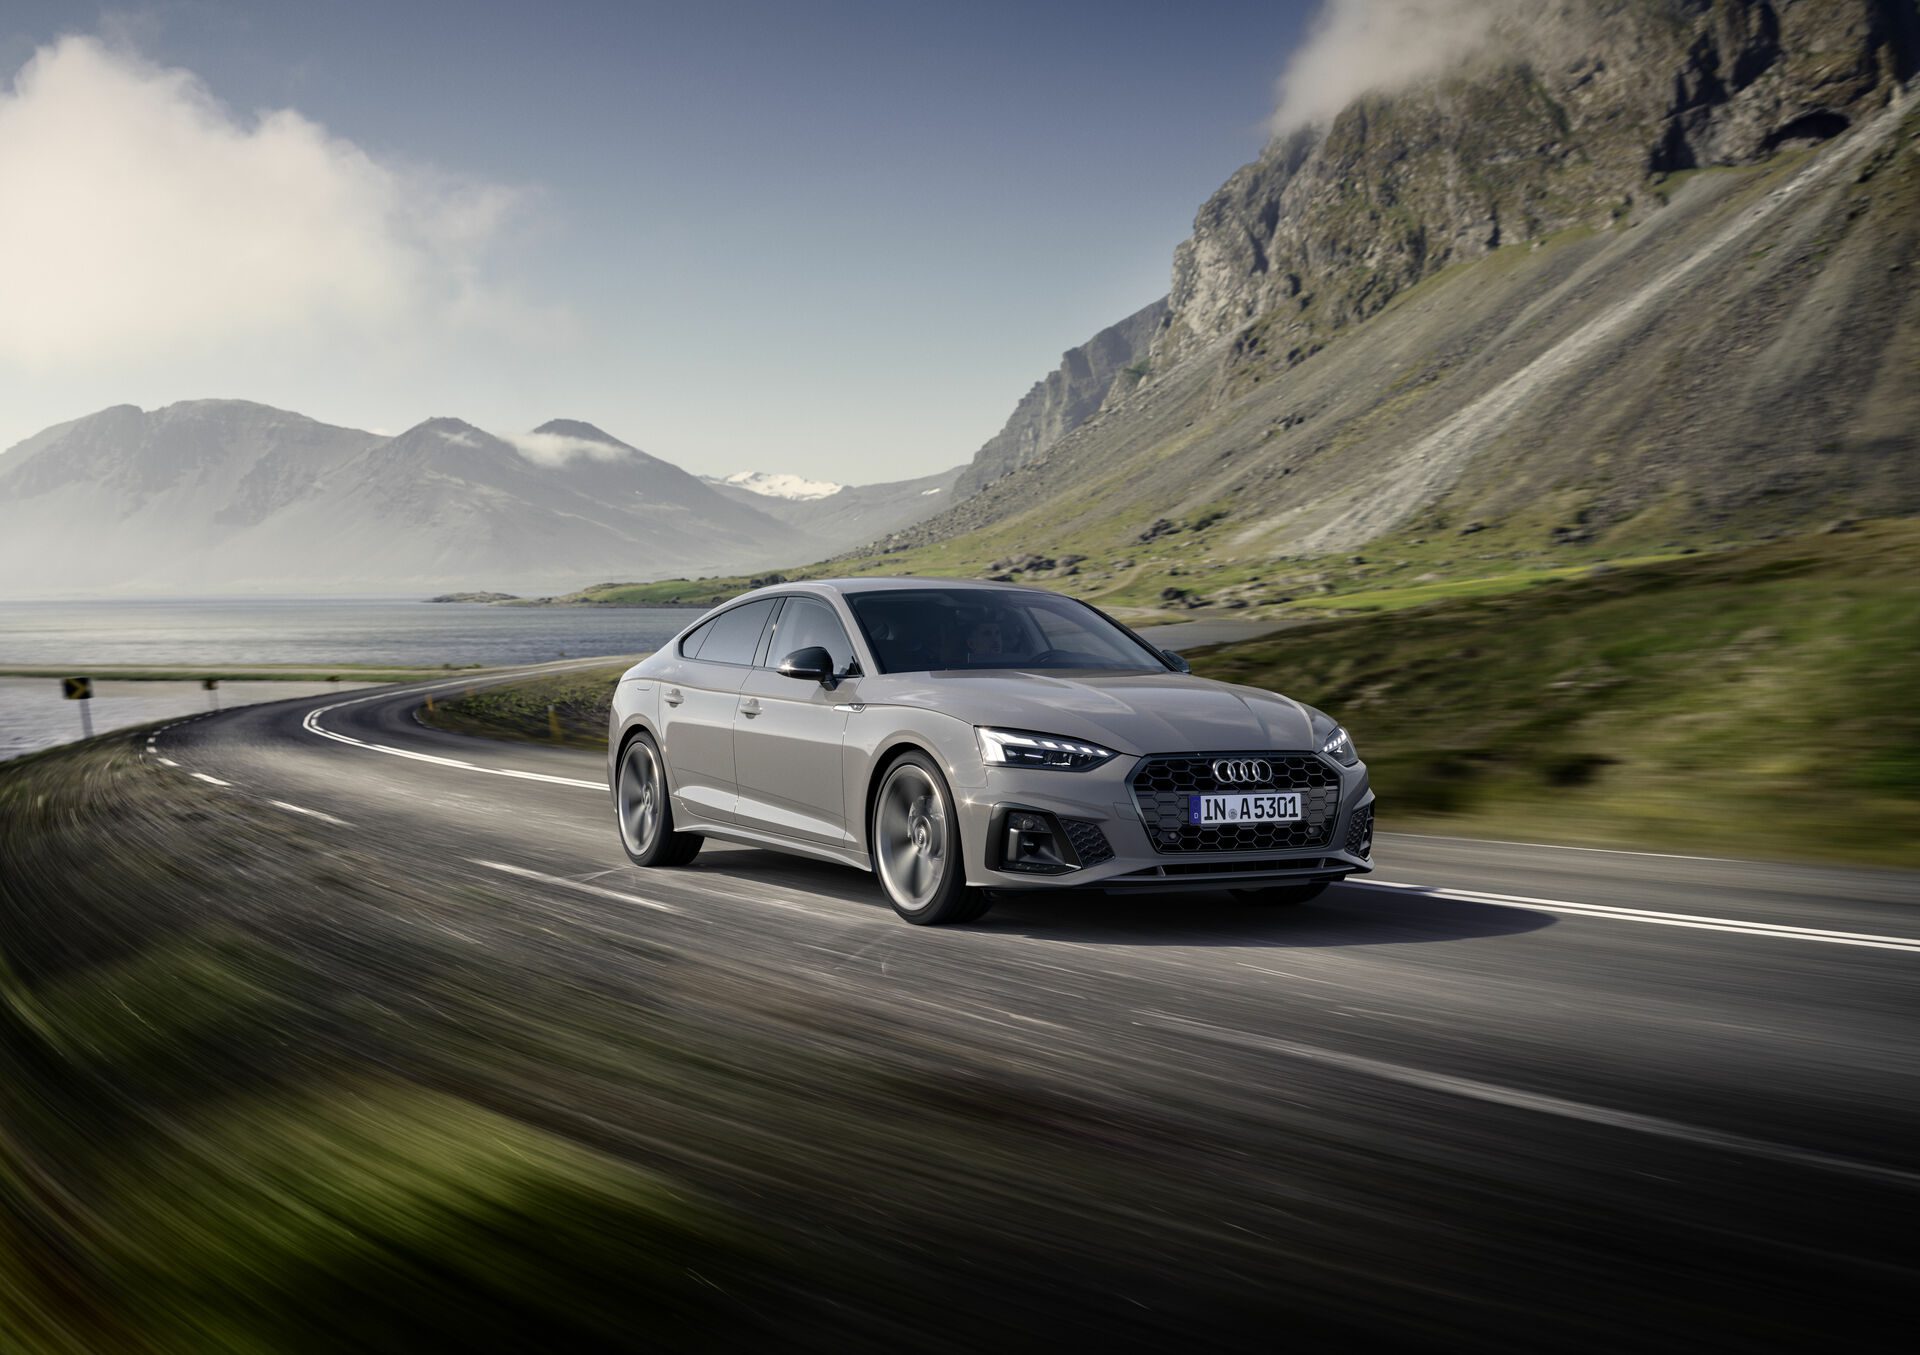
Audi A5
Base Coupe: $47,700 / A5 Coupe: $ 56,800 / RS5 Coupe: $78,600 / A5 Sportback: $45,500 / S5 Sportback: $56,800 / RS 5 Sportback: $78,900 / A5 Cabriolet: $54,900 / S5 Cabriolet: $65,400
The Audi A5 and S5 are two of Audi’s most popular cars. They are both mid-size luxury cars that are available in a variety of body styles, including a coupe, convertible, and Sportback. The A5 is powered by a turbocharged 2.0-liter four-cylinder engine that produces 201 horsepower and 236 pound-feet of torque. It is mated to an eight-speed automatic transmission and front-wheel drive. All-wheel drive is available as an option. The S5 is powered by a turbocharged 3.0-liter V6 engine that produces 354 horsepower and 369 pound-feet of torque. It is mated to an eight-speed automatic transmission and all-wheel drive.
Both the A5 and S5 come standard with a variety of features, including a 10.25-inch digital instrument cluster, a 10.1-inch touchscreen infotainment system, Apple CarPlay and Android Auto, a rearview camera, and a sunroof. Available features include a Bang & Olufsen sound system, a head-up display, a panoramic sunroof, and a wireless charging pad. The A5 starts at $47,700, and the S5 starts at $56,900. The Audi RS5 is the high-performance version of the A5. It is powered by a twin-turbocharged 2.9-liter V6 engine that produces 444 horsepower and 443 pound-feet of torque. It is mated to an eight-speed automatic transmission and all-wheel drive. The RS5 can go from 0 to 60 mph in 3.5 seconds. It gets an EPA-estimated 21 mpg in the city and 25 mpg on the highway. The RS5 is available in coupe and Sportback body styles. It starts at $78,600.
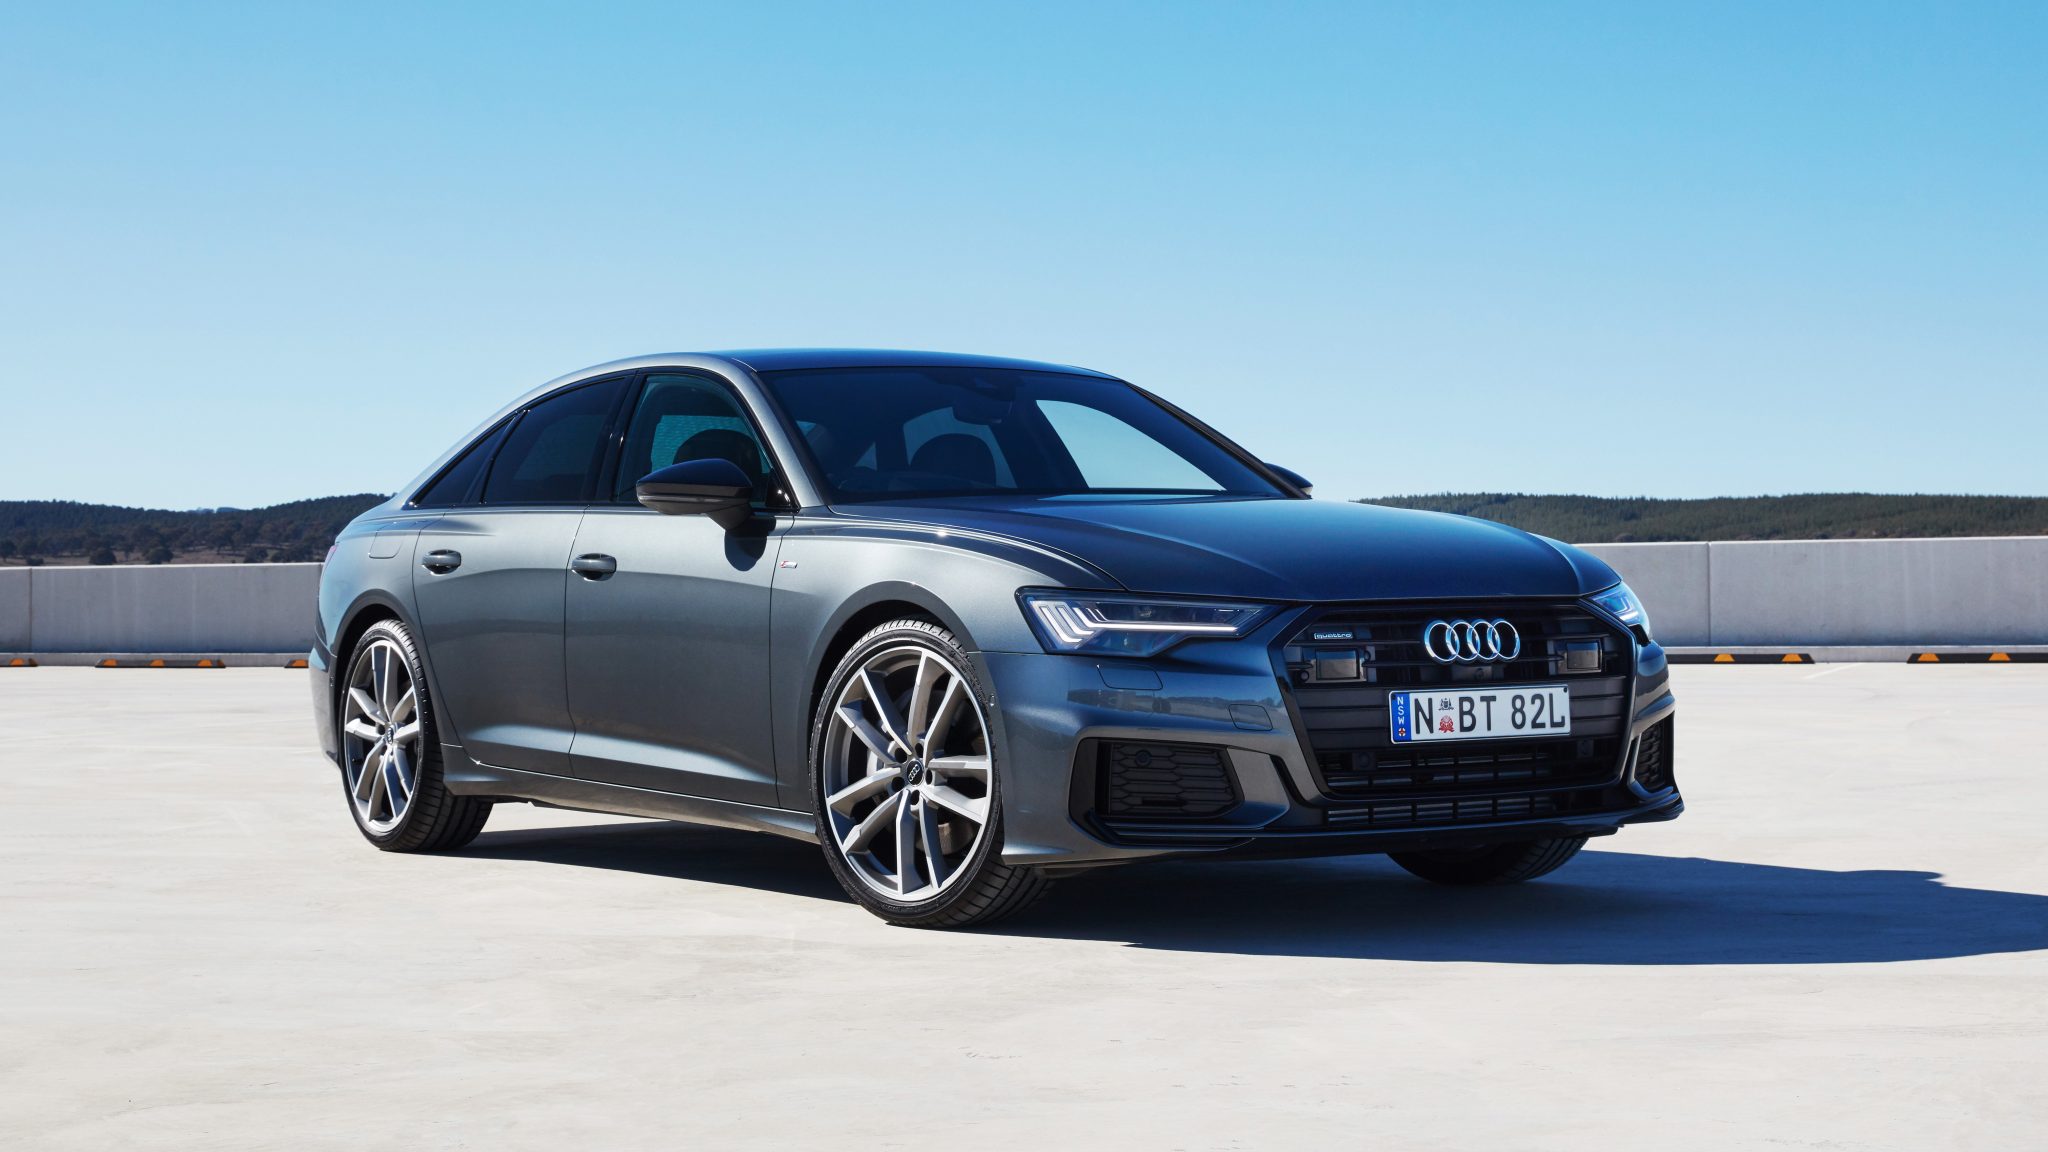
Audi A6
Base: $56,900 / S6 Sedan: $73,700 / A6 allroad: $67,900 / RS 6 Avant: $125,800
The Audi A6, S6, and RS6 Avant are all mid-size luxury cars. The A6 is the base model, the S6 is the performance version, and the RS6 Avant is the high-performance wagon version. The A6 is powered by a turbocharged 2.0-liter four-cylinder engine that produces 248 horsepower and 273 pound-feet of torque. It is mated to an eight-speed automatic transmission and front-wheel drive. All-wheel drive is available as an option. The S6 is powered by a turbocharged 3.0-liter V6 engine that produces 335 horsepower and 369 pound-feet of torque. It is mated to an eight-speed automatic transmission and all-wheel drive.
The RS6 Avant is powered by a twin-turbocharged 4.0-liter V8 engine that produces 591 horsepower and 590 pound-feet of torque. It is mated to an eight-speed automatic transmission and all-wheel drive. All three models come standard with a variety of features, including a 10.25-inch digital instrument cluster, a 10.1-inch touchscreen infotainment system, Apple CarPlay and Android Auto, a rearview camera, and a sunroof.
The A6 starts at $56,900, the S6 starts at $73,700, and the RS6 Avant starts at $125,800.
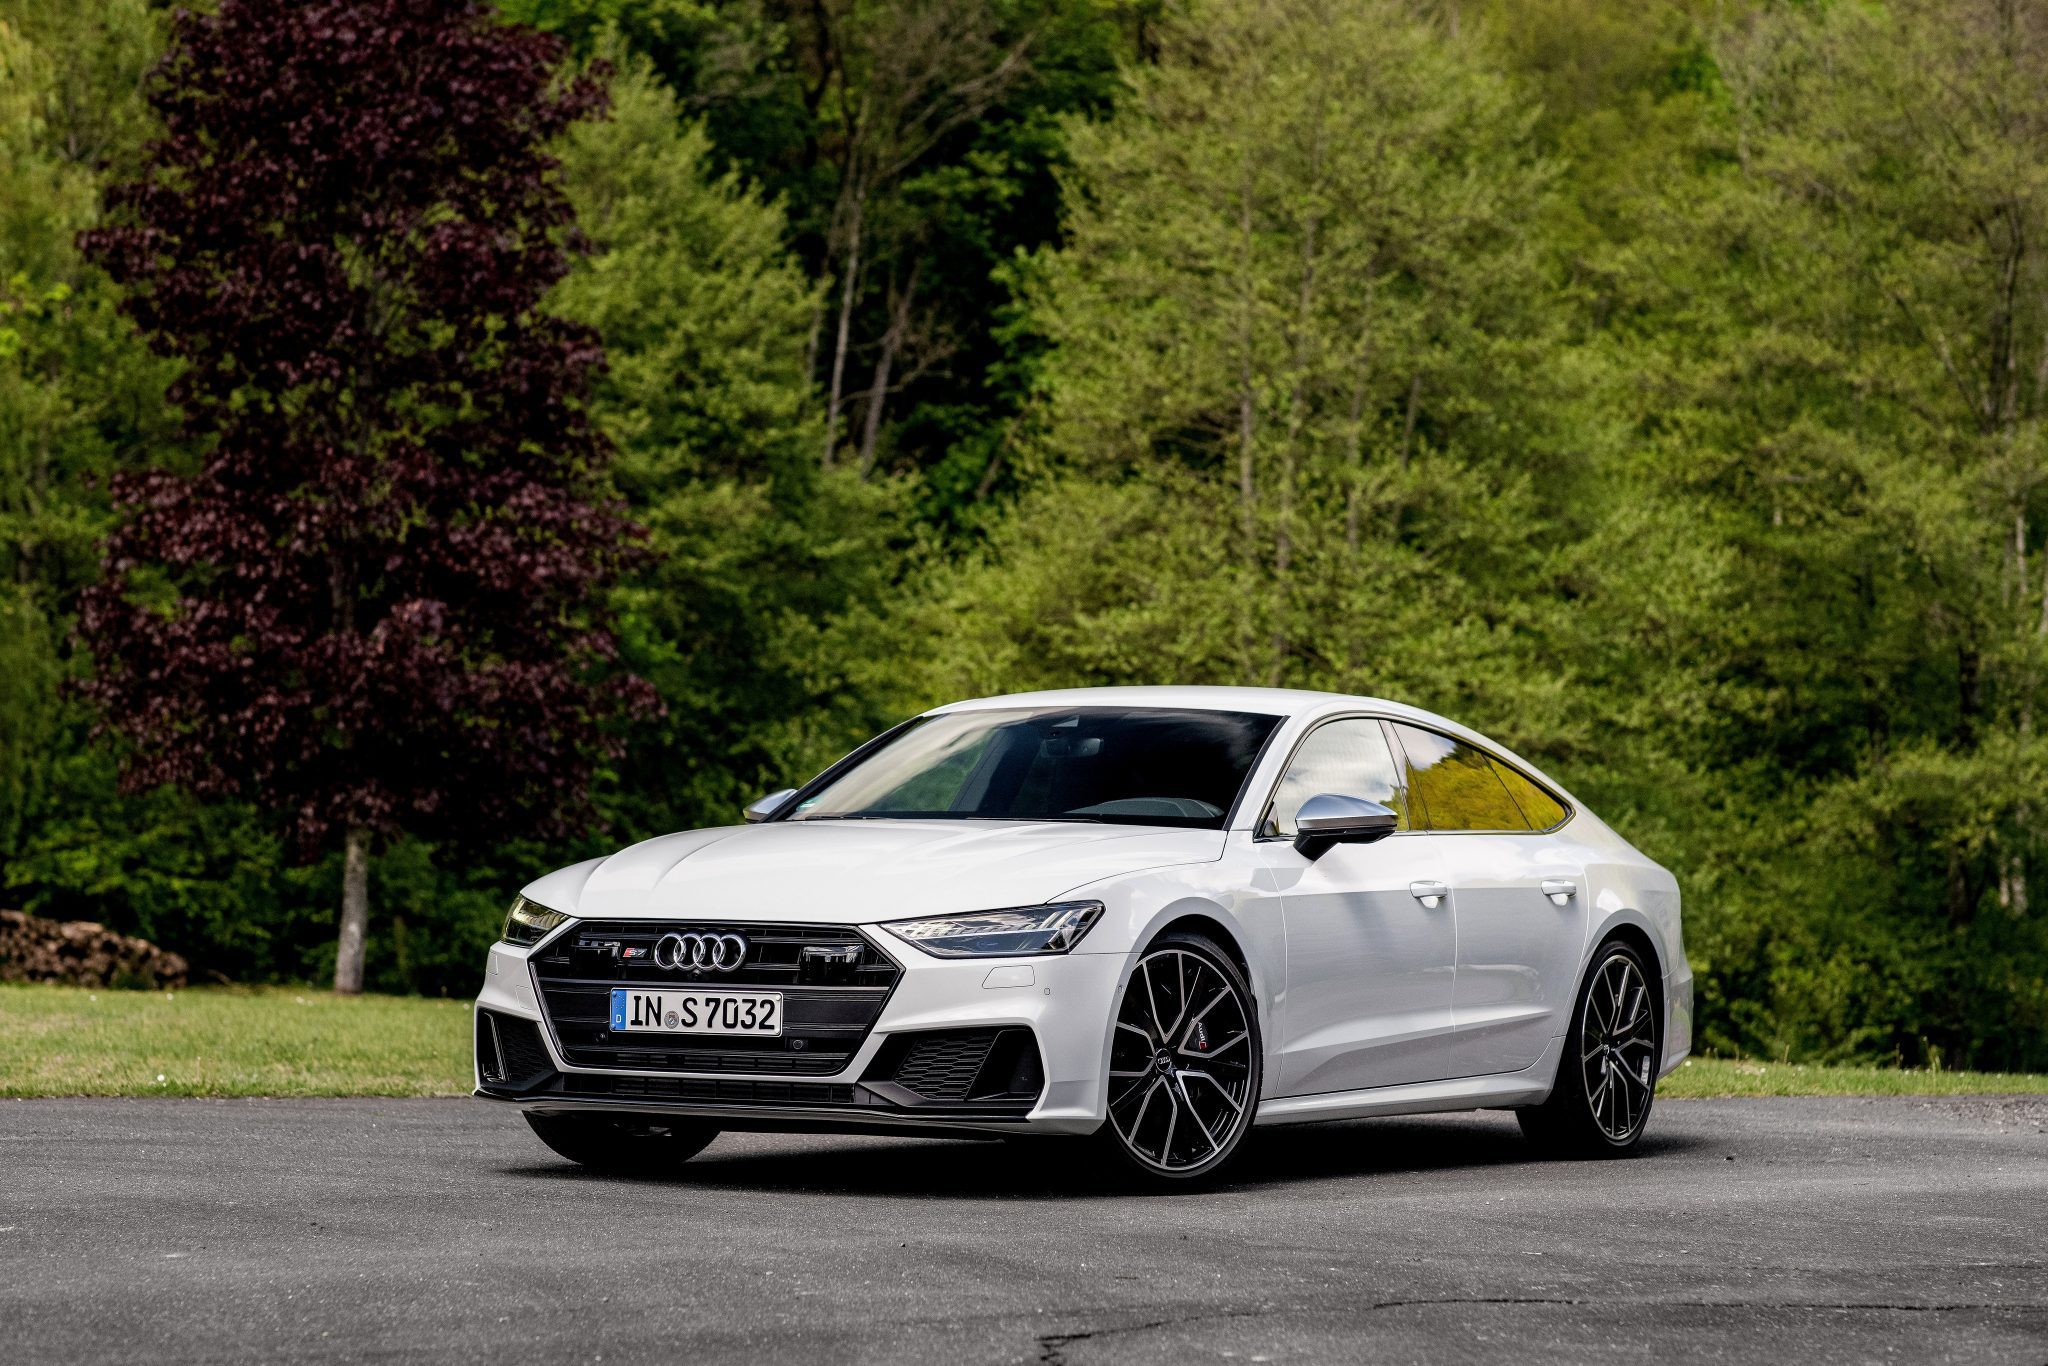
Audi A7
Base: $70,200 / S7: $83,500 / RS 7: $127,800
The Audi A7, S7, and RS7 are all luxury sportback models. The A7 is the base model, the S7 is the performance version, and the RS7 is the high-performance version. The A7 is powered by a turbocharged 2.0-liter four-cylinder engine that produces 248 horsepower and 273 pound-feet of torque. It is mated to an eight-speed automatic transmission and all-wheel drive.
The S7 is powered by a turbocharged 3.0-liter V6 engine that produces 349 horsepower and 369 pound-feet of torque. It is mated to an eight-speed automatic transmission and all-wheel drive. The RS7 is powered by a twin-turbocharged 4.0-liter V8 engine that produces 591 horsepower and 590 pound-feet of torque. It is mated to an eight-speed automatic transmission and all-wheel drive.
All three models come standard with a variety of features, including a 10.25-inch digital instrument cluster, a 10.1-inch touchscreen infotainment system, Apple CarPlay and Android Auto, a rearview camera, and a sunroof. Available features include a Bang & Olufsen sound system, a head-up display, a panoramic sunroof, and a wireless charging pad.
The A7 starts at $56,900, the S7 starts at $73,900, and the RS7 starts at $112,900.
Audi A8
Base: $88,900 / S8: $120,600
The Audi A8 is a full-size luxury sedan that was first released in 1994. It is the flagship model in Audi’s lineup. The A8 is available in two body styles: sedan and long-wheelbase sedan. The A8 can go from 0 to 60 mph in 5.7 seconds for the base engine. It gets an EPA-estimated 19 mpg in the city and 27 mpg on the highway. The A8 is a good choice for anyone looking for a luxurious and technologically advanced full-size sedan. It offers a blend of performance, luxury, and technology.


