The Audi A5
Below we have the Audi A5 sales figures and reporting data for the United States, Canada and Europe. The A5 is the techy, luxury cruiser of the entry level luxury segment. With arguably the nicest design in the segment it is viewed by many as all style and technology with little substance as a sporty car. Audi tells us the 2018 redesigned A5 model is going to correct that with less weight up front and big improvements to the electric power steering which Audi says is now quicker and more precise. The all new Audi A5 and S5 Coupé are based on the ninth generation of the Volkswagen Group MLB Platform. Two gasoline and two diesel engines are offered for the A5 while the S5 gets a turbocharged 3.0 litre engine. The 5 door liftback model Audi A5 and S5 Sportback were released in September 2016. They are powered by the same engines as the A5 and S5 Coupé respectively and we expect them to also be updated this coming year.
Audi A5 Overview
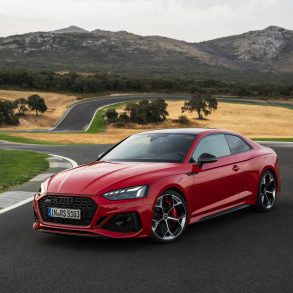
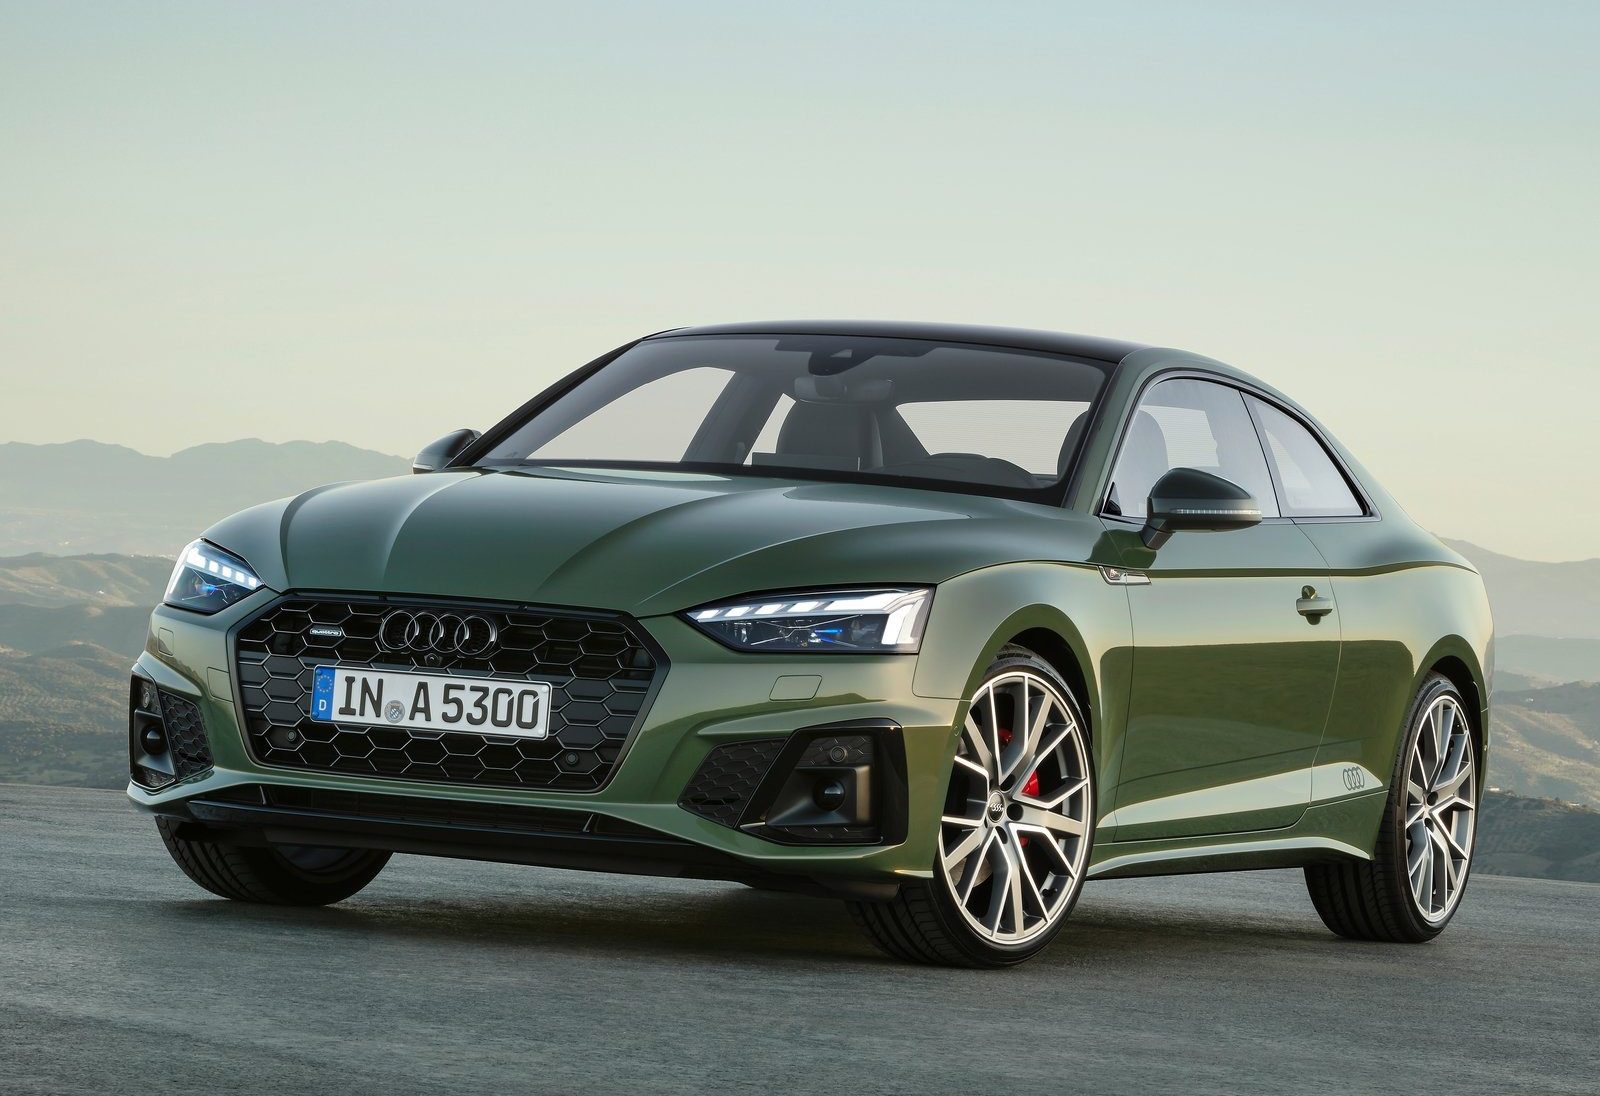
The Audi A5 was first introduced in 2007 as a coupe model, and since then, the A5 lineup has expanded to include various body styles, including a convertible (Cabriolet) and a four-door sportback (Sportback). The A5 is known for its elegant design, advanced technology, and enjoyable driving dynamics, making it a popular choice in the premium car market. The Audi A5 features a sophisticated and modern design, showcasing Audi’s signature design language with clean lines and a sporty appearance. The front end is characterized by Audi’s iconic Singleframe grille, flanked by stylish headlights with available LED or matrix LED technology. The A5’s design emphasizes both elegance and athleticism, giving it a strong visual presence. The Audi A5 offers a range of engine options, including turbocharged petrol (gasoline) and diesel engines. The engine choices vary depending on the model year and the market. Audi provides various power outputs and performance levels to cater to different customer preferences, with higher-performance variants typically available under the S and RS badges.
Audi A5 Sales Data & Trends
The Audi A5 has been well-received by both automotive critics and buyers, and it has remained a strong contender in the compact luxury sedan segment. It offers a combination of luxury, technology, and performance that makes it a compelling choice for those seeking a premium driving experience. It sells strongly across the major markets, but has lost some favor in recent years as people switch to SUV options.
Audi A5 U.S Sales Data & Charts
U.S Monthly Sales
U.S Annual Sales
| Year | Sales Units |
|---|---|
| 2007 | 625 |
| 2008 | 6,282 |
| 2009 | 9,800 |
| 2010 | 16,379 |
| 2011 | 15,385 |
| 2012 | 17,270 |
| 2013 | 18,664 |
| 2014 | 16,640 |
| 2015 | 12,934 |
| 2016 | 8,354 |
| 2017 | 21,301 |
| 2018 | 25,972 |
| 2019 | 23,023 |
| 2020 | 18,827 |
| 2021 | 17,128 |
| 2022 | 18,349 |
| 2023 | 23,807 |
| 2024 | 4,797 |
U.S Annual Growth
Audi A5 Canada Sales Data & Charts
Canada Annual Sales
Year Sales Units
2012
2,024
2013
2,351
2014
2,164
2015
1,693
2016
1,516
2017
3,671
2018
4,589
2019
4,223
2020
2,507
2021
2,621