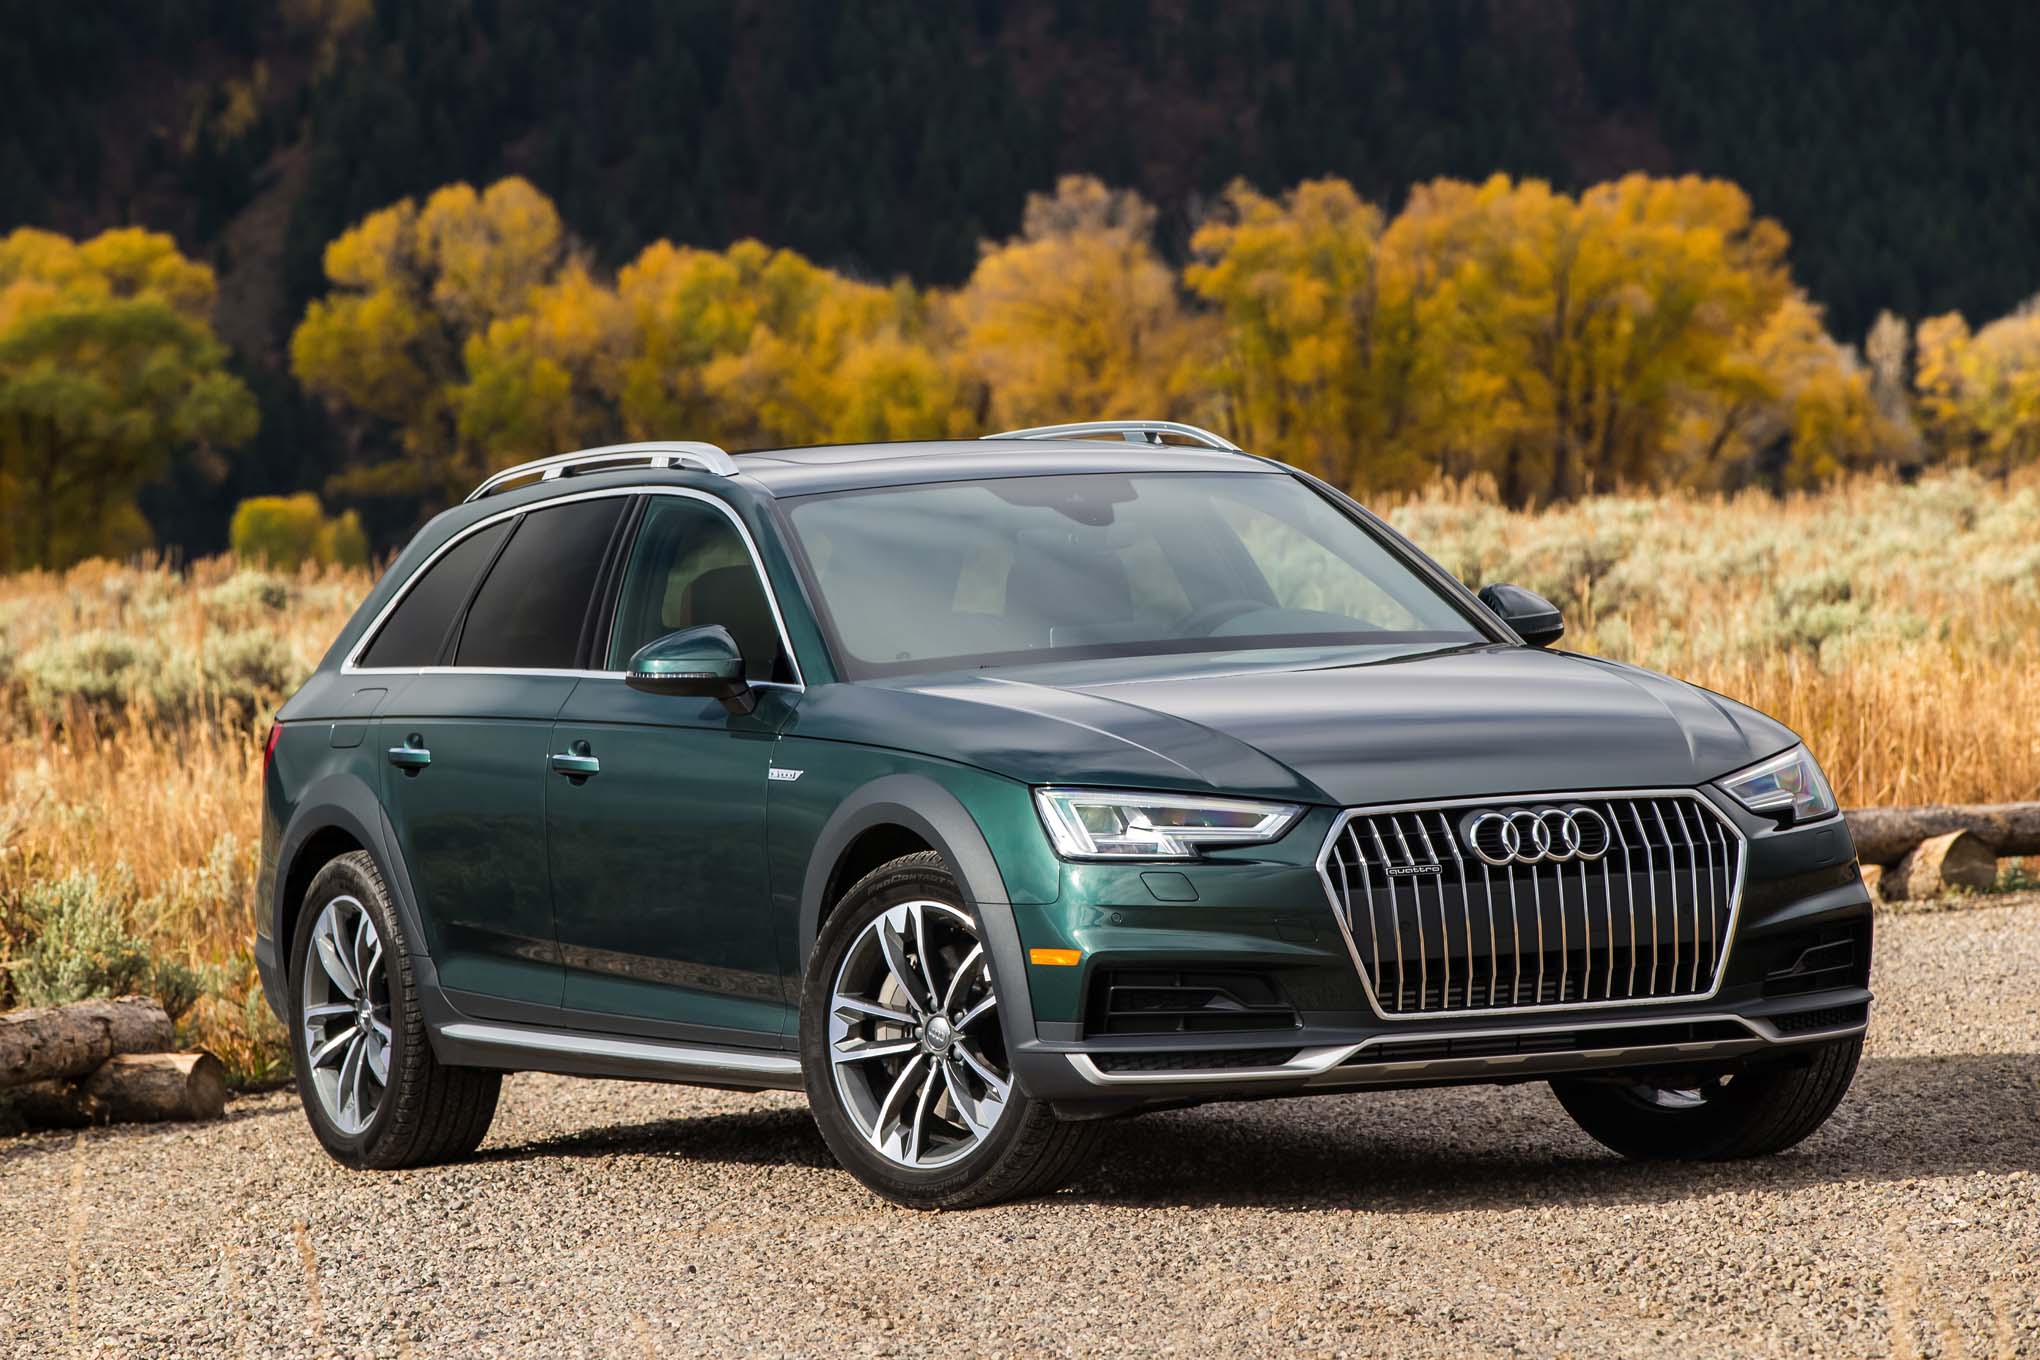
The Audi A4 Allroad
Below we have the Audi A4 Allroad sales figures and reporting data for the United States and Canada. Let’s start by saying that the Allroad sites in a real niche market. It is not a decent off-roader with great all-wheel drive versatility standard and wagon practicality built into a nicely designed body with all the Audi build quality benefits we take for granted. It hits the mark if you want room and utility without having to buy a crossover or SUV like everybody else. It’s a fine highway cruiser and easily tackles country roads. Competitors include the Mercedes-Benz E-class Wagon, Volvo V90 Cross Country and BMW 3-series Wagon. Note that Audi A4 sales includes Audi A4 Sedan and Audi S4 Sedan, but does not include Audi A4 allroad which is why we report them separately here, up till 2018.
Audi A4 Allroad Overview
The Audi A4 Allroad is a variant of the Audi A4, a popular compact luxury sedan. The A4 Allroad is essentially a rugged and more versatile version of the standard A4, offering increased ground clearance and additional off-road capabilities. It is marketed as a crossover or “all-terrain” vehicle, combining the practicality and space of a wagon with the adventurous spirit of an SUV.
Audi A4 Allroad U.S Sales Data & Trends
This sales table of Audi A4 Allroad cars sold in the United States and Canada.
U.S Annual Sales
| Year | Total |
|---|---|
| 2004 | 4,626 |
| 2005 | 2,429 |
| 2006 | 3 |
| 2012 | 1,283 |
| 2013 | 4,096 |
| 2014 | 4,686 |
| 2015 | 2,818 |
| 2016 | 2,300 |
| 2017 | 3,240 |
| 2018 | 255 |
U.S Annual Growth